

Published: 28th Jan, 2024
Analysing the rising gap in incomes
Context
There are certain discrepancies in the recent report by the State Bank of India (SBI) which highlights that India has witnessed a significant fall in inequality over the last decade.
Key Concerns with the Report –
- Challenges in Data Analysis:
- The analysis is based on taxpayer data, presenting challenges as a significant portion of income-earners falls below the tax threshold.
- Preliminary nature of the study necessitates further research to account for potential errors, self-reporting issues, and seasonal adjustments.
- Gini Coefficient Trends (2017-18 to 2022-23)
|
What is Gini Coefficient?
|
- The Gini coefficient, representing income inequality, decreased from 0.4297 to 0.4197 during the period.
- Disaggregated by employment type, the Gini coefficient fell for regular wage and casual wage workers but rose slightly for the self-employed.

- Polarisation in Income Growth
- An analysis of decile-wise income growth reveals a polarisation trend, especially among self-employed workers.
- While the majority experienced healthy income growth (8%-9%), the top 10% saw a rate of around 7.23%, outpacing the bottom 20% with only 1.67% growth.

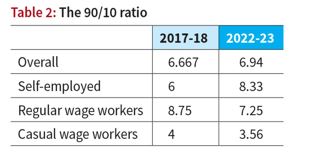
- 90/10 Ratio and Self-Employed Divergence
- The 90/10 ratio, measuring income gap between the top and bottom 10%, increased from 6.7 to 6.9.
- Notably, the 90/10 ratio significantly rose for self-employed individuals, with the income of the top 10% being 8.3 times that of the bottom 10%.
- Impact of Women's Labor Force Participation
- The rise in women's labor force participation, primarily in low-paid, part-time self-employed work, contributes to increased income gaps among the self-employed.
- While overall Gini coefficient reduction suggests lower inequality, the divergence in self-employed incomes contradicts this trend.
Consequences of Discrepancies in Income Inequality Studies
- Policy Misdirection:
- Inaccuracies in studies can lead to misguided policy decisions, hindering effective strategies to address income inequality.
- Public Trust Erosion:
- Conflicting findings may erode public trust, creating skepticism about the severity of income inequality and impeding support for necessary interventions.
- Inequality Denial:
- Discrepancies provide room for denial, hindering efforts to tackle root causes and promote social and economic justice.
- Resource Allocation Challenges:
- Challenges in resource allocation arise, with policymakers struggling to distribute resources effectively based on inconsistent data.
- Benchmarking Difficulty:
- Establishing benchmarks for measuring progress becomes challenging, impeding the assessment of policy impact over time.
- Impact on Research:
- Persistent discrepancies may slow progress in understanding income inequality dynamics within the academic community.
- Ineffective Advocacy:
- Advocacy efforts are weakened as inconsistent data hampers the ability to strengthen arguments and mobilize support for change.
- Global Cooperation Hurdles:
- Global comparisons and cooperation face obstacles due to inconsistent data, hindering coordinated strategies to address income disparities globally.