

Published: 5th Oct, 2019
Niti Aayog released School Education Quality Index (SEQI) for the year 2016-17.
Context
Niti Aayog released School Education Quality Index (SEQI) for the year 2016-17.
About
- The School Education Quality Index (SEQI) was developed to evaluate the performance of States and Union Territories (UTs) in the school education sector.
- The index aims to bring an outcomes focus to education policy by providing States and UTs with a platform to identify their strengths and weaknesses and undertake requisite course corrections or policy interventions.
- In line with NITI Aayog’s mandate to foster the spirit of competitive and cooperative federalism, the index strives to facilitate the sharing of knowledge and best practices across States and UTs.
Aim and Purpose of the index:
- SEQI aims to drive policy reforms that will improve the quality of school education.
- The index seeks to institutionalise a focus on enhancing education outcomes by driving improvements in learning levels, access, equity, infrastructure and governance processes.
- The index recognises that school education is a subject on the Concurrent List and that State-level leadership is crucial for improving outcomes in a cost-effective manner.
- The index will serve as a regular and transparent review of the status of school education quality across the States and UTs.
Index categories and Domains:
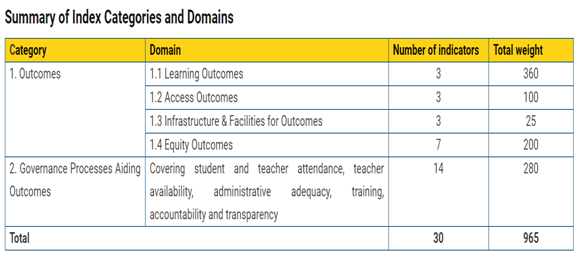
- SEQI is based on a set of indicators that measure the overall effectiveness, quality and efficiency of the Indian school education system.
- To facilitate like-to-like comparisons, States and UTs have been grouped as Large States, Small States and Union Territories. Within each of these groups, the indicator values have been appropriately scaled, normalized and weighted to generate an overall performance score and ranking for each State and UT.
- States and UTs are ranked on their overall performance in the reference year 2016-17, as well as on the change in their performance between the reference year and base year (2015-16). The rankings present incredible insights on the status of school education across States/UTs and their relative progress over time.
Key findings of the report:
Large states:
|
Large states:
|
- Kerala topped the list of large states in India in the Overall Performance and Rank in school education for the year 2016-17 with a total evaluation point of 82.2%.
- Tamil Nadu retained the second spot with 73.4% points.
- Kerala and Tamil Nadu were the top two performing states at the national level in the academic year 2015-16 as well.
- Uttar Pradesh ranks last among the Large States, with an overall performance score of 36.4 percent.
- Kerala, Rajasthan, Karnataka, Andhra Pradesh, Gujarat and Assam are the best-performing Large States, each achieving an overall performance score above 60.0 percent.
- In the Outcomes category, Karnataka leads the Large States, with a score of 81.9 percent while Uttar Pradesh has the lowest score of 34.1 percent.
- In the Governance Processes Aiding Outcomes category, Kerala has the highest score of 79.0 percent while Jharkhand comes in last with a score of 21.0 percent.
Small states:
|
Small States:
|
- Manipur, Tripura and Goa are the top-performing Small States, each achieving an overall performance score above 55 percent.
- Manipur has the highest overall performance score of 68.8 percent.
- Arunachal Pradesh ranks last, with an overall performance score of 24.6 percent.
- Manipur ranks first among the Small States on the Outcomes category, with a score of 82.1 percent. Arunachal Pradesh has the lowest score, at 27.2 percent.
- In the Governance Processes Aiding Outcomes category, Mizoram has the highest score of 47.5 percent while Arunachal Pradesh ranks last with a score of 18.3 percent.
Union Territories:
- Chandigarh and Dadra & Nagar Haveli are the top-performing UTs, with each achieving an overall performance score above 50.0 percent.
- Chandigarh has the highest overall performance score of 82.9 percent while Lakshadweep ranks last, with an overall performance score of 31.9 percent.
- Chandigarh is also the best-performing UT on the Outcomes and Governance Processes Aiding Outcomes categories, with scores of 88.4 percent and 69.5 percent respectively. Lakshadweep received the lowest score (28.9 percent) on the Outcomes category while Dadra & Nagar Haveli received the lowest score (33.5 percent) on the Governance Processes Aiding Outcomes category.