

Categories: Society: Diverse Elements, Published: 11th Oct, 2022
Introduction:
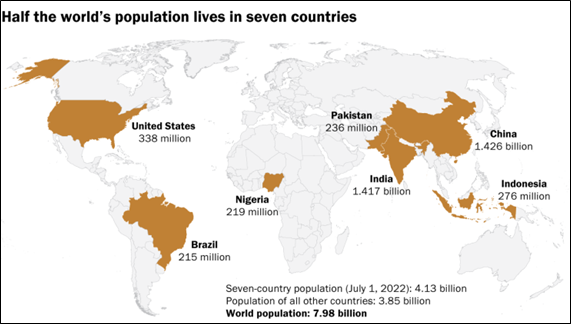
- India with 1.417 billion people is expected to claim the title of the most populated country next year, but with an average age of 29, it has one of the youngest populations As this pool of resources of young citizens enters the workforce, it could create a ‘demographic dividend. A demographic dividend refers to the growth in an economy that is the result of a change in the age structure of a country’s population. The change in age structure is typically brought on by a decline in fertility and mortality rates. In other words, the number of the working-age population becomes larger than the number of dependents.
India’s Demographic Dividend
- According to the United Nations Population Fund (UNFPA), a demographic dividend means the economic growth potential that can result from shifts in a population’s age structure.
- In order to summarize the age distribution, we use “median age”. It is the age that divides a population into two numerically equally sized groups; that is, half the people are younger than this age and half are older.
- In this case, it is the working-age population (15 to 64) and the non-working-age population (14 and younger, and 65 and older). The earlier is larger than the later. In the Indian context, the median age in India is 28 years, compared to 38 in China and the US, 43 in Western Europe, and 48 in Japan.
- India is home to a fifth of the world’s youth demographic and this population advantage could play a critical role in achieving the nation’s ambitious target to become a US$ 5 trillion economy.
Diversity in India’s States:
- Although India is a young country, the number and pace of population-ageing vary among States. For example, the southern states, which are advanced in demographic transition, already have a higher percentage of older people.
- While Kerala’s population is already ageing, in Bihar the working-age cohort is predicted to continue increasing till 2051. These differences in age structure reflect differences in the economic development and health of the states.
Areas where a country can find demographic dividends:
- Savings: During the demographic period, personal savings grow and can be used to stimulate the economy.
- Labour supply: More workers are added to the labour force, including more women.
- Human capital: With fewer births, parents are able to allocate more resources per child, leading to better educational and health outcomes.
- Economic growth: GDP per capita is increased due to a decrease in the dependency ratio
Scope for India:
- India is in the middle of a demographic transition
-
- With falling fertility (currently 2.0)
- Rising median age (from 29 years now and expected to be 36 years by 2036)
- A falling dependency ratio (expected to decrease from 65% to 54% in the coming decade)
- This provides a window of opportunity towards faster economic growth and India has already begun to get the dividend.
- But, the benefit to the GDP from the demographic transition in India has been lower than its peers in Asia and is already tapering.
Fertility Must Decline to Attain the Demographic Dividend:
- It is a common misperception that a large youth population itself is an indicator of a coming demographic dividend. The key first step toward the demographic dividend is not a large youth population, rather it is a transition from high birth and death rates to low birth rates and child death rates—a process referred to as the “demographic transition”.
Demographic Transition Model (DTM)
- The demographic transition model (DTM) shows shifts in the demographics of a population during economic and social development. This transition is two-fold: both death and birth rates go from high to low over time as development progresses.
- The demographic transition model operates on the assumption that there is a strong association between birth and death rates, on the one hand, and industrialization and economic development on the other.
Demographic Transition Model Stages:
Stage 1: This is a state of high birth and death rates culminating in low population growth overall.
Stage 2: With a consistently high birth rate and decreasing death rate, population growth surges.
Stage 3: As the birth rate falls and the death rate remains low, the population continues to increase.
Stage 4: Traditionally considered to be the final stage, this is one of demographic stabilization, in which both birth and death rates are low. This means that the overall population stays fairly low.
Stage 5: In the last stage, both fertility and mortality decline considerably. The population is either stable or grows slowly.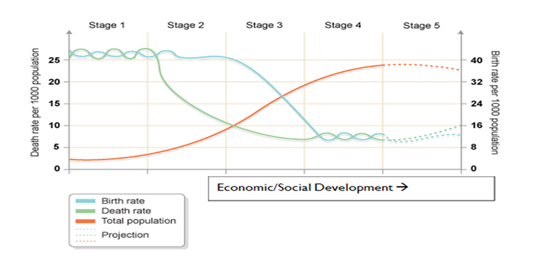
How Long Does Demographic Transition Take?
- Although the demographic transition model establishes a general structure for what is likely to happen as societies experience economic and social development, it does not suggest any time frame for how long this will take to occur. This is a limitation in the forecasting ability of the DTM.
- Historically, the rate of demographic transition has varied enormously. Certain countries have passed through multiple stages quite rapidly, including Brazil as well as China (credit also goes to their One-Child Policy).
- By contrast, other societies remain at the second stage of the DTM as a result of additional social obstacles and roadblocks to development, such as widespread and debilitating outbreaks of disease.
Limitations of the Demographic Transition Model (DTM)
- Limited Predictive Capacity: It must be noted that it is a model and not an absolute equation. It cannot reliably predict what will actually happen, and certainly cannot do so in great detail.
- Each country has its own set of social and cultural attributes that can heavily influence its demographics, causing them to operate differently than you might expect based solely on the DTM.
- The DTM itself continues to shift: Initially, the demographic transition model had just four stages. Demographers then added a fifth stage to accommodate new trends in development they had noticed. This contested status demonstrates that the model is not set in stone enough to be considered foolproof. The DTM is likely to continue to evolve as the real world evolves.
- Significant influence of migration: Migration is also a significant factor in demographic shifts and one for which the demographic transition model does not explicitly account. Both in and out-migration affect natural and actual increases and decreases in population.
- The effect of migration depends especially on migrants’ fertility, social attitudes, age, gender, and other identity factors.
Achieving replacement fertility level by southern states:
- National Family Health Survey-5 (NFHS-5) suggest that we are entering an era where we will have to tackle these challenges. NFHS-5 places the total fertility rate (TFR) at 2.0. With two parents having two children, we have reached a replacement level of fertility. This decline is spread evenly across the country, with 29 states and UTs having a TFR of 1.9 or less, with seven below 1.6.
- All southern states have a TFR of 1.7-1.8, similar to that of Sweden. This success, however, brings its challenge. As fertility declines, the proportion of the older population grows, and societies face the challenge of supporting an ageing population with a shrinking workforce.
- According to the National Statistical Office, while the proportion of the population greater than age 60 was 8.6 per cent for India as a whole in 2011, it was 12.6 per cent for Kerala and 10.4 per cent for Tamil Nadu, projected to increase further to 20.9 per cent and 18.2 per cent respectively by 2031.
- Impact of Migration: Nowadays economic activities of these states started increasingly relying on semi-skilled migrant labour from the northern and eastern states of Bihar, Uttar Pradesh and Odisha. They often work under contractual arrangements.
South India loses out to north in Finance:
- South Indian states raise concerns over the terms of reference for the 15th Finance Commission alleging that they would be at a disadvantage, south Indian states have reduced their fertility rates below replacement level, while the rate for states such as Bihar and Uttar Pradesh remain above the level.
- In 2016, Tamil Nadu’s total fertility rate (TFR)–the number of children a woman will have in a lifetime–was the lowest among India’s large states at 1.6, and other south Indian states–Andhra Pradesh and Telangana (1.7), Kerala and Karnataka (1.8)–also have rates below the replacement level of fertility, according to the latest Sample Registration System data, under Office of the Registrar General & Census Commissioner, India. The national average TFR was 2.3.
- The Terms of Reference (ToR) proposed to the 15th Finance Commission–which lays out the roadmap for revenue sharing between the Centre and states, and among states–suggest taking into account the 2011 census, instead of the 1971 census which was used earlier.
- The central government has proposed that the 15th Finance Commission incentivise states who have taken efforts to control population growth.
Reaping India’s demographic dividend
- India has a unique opportunity to develop and grow richer before ageing sets in. A nation’s growth requires the productive contribution of all segments of society, particularly the children and the youth, who need to be provided opportunities for self-expression.
- As fertility declines, the share of the young population falls and that of the older, dependent population rises. If the fertility decline is rapid, the increase in the population of working age is substantial yielding the ‘demographic dividend’.
- The smaller share of children in the population enables higher investment per child. Therefore, the future entrants in the labour force can have better productivity and thus boost income. With the passage of time, the share of the older population rises and that of the working-age population begins to fall hence the dividend is available for some time, ‘the window of demographic opportunity.
Forward-looking policies:
- Updated National Transfer Accounts (NTA) assessment: we find that India’s per capita consumption pattern is way lower than that of other Asian countries. A child in India consumes around 60% of the consumption by an adult aged between 20 and 64, while a child in China consumes about 85% of a prime-age adult’s consumption.
- The NTA data for India needs to be updated to capture the progress made on such investments since 2011-12. State-specific NTAs need to be calculated every year and States need to be ranked for investing in the youth.
- Invest more in children and adolescents: India ranks poorly in Asia in terms of private and public human capital spending. It needs to invest more in children and adolescents.
- Make health investments: Public spending on health has remained flat at around 1% of GDP. Evidence suggests that better health facilitates improved economic production. Hence, it is important to draft policies to promote health during the demographic dividend.
- New federal approach to governance reforms for the demographic dividend will need to be put in place for policy coordination between States on various emerging population issues such as migration, ageing, skilling, female workforce participation and urbanisation.
- Address the diversity between States: While India is a young country, the status and pace of population ageing vary among States. The southern States, which are advanced in demographic transition, already have a higher percentage of older people.
- These differences in age structure reflect differences in economic development and health – and remind us of States’ very different starting points at the outset of the 2030 Sustainable Development Goals Agenda.
- But this also offers boundless opportunities for States to work together, especially on demographic transition, with the north-central region as the reservoir of India’s workforce.
Conclusion:
The demographic dividend opportunity in the country is the longest in the world, accessible for 5 decades, starting from 2005 to 2055. Owing to the change in patterns and demographics, India is expected to emerge as one of the largest consumer economies in the world.
The surge in the young, working population presents multiple unique and interesting possibilities for India’s future, in terms of economic growth, social mobility, and even a more inclusive and diverse cultural fabric.
Related Articles