Economy: Developmental Economics
Developmental Economics
Introduction:
- Development economics is a branch of economics that focuses on improving fiscal, economic, and social conditions in developing countries.
- Development economics considers factors such as health, education, working conditions, domestic and international policies, and market condition with a focus on improving conditions in the world's poorest countries.
- Development economics studies the transformation of emerging nations into more prosperous nations. Strategies for transforming a developing economy tend to be unique because the social and political backgrounds of countries can vary dramatically.
- Some aspects of development economics include determining to what extent rapid population growth helps or hinders development, the structural transformation of economies, and the role of education and health care in development.
- They also include international trade and globalization, sustainable development, the effect of epidemics such as HIV and AIDS, and the impact of catastrophes on economic and human development.
Main Indicators of the Developmental economics:
- Poverty
- Unemployment
- Social Infrastructure
Poverty:
Concept:
- Poverty is a social phenomenon wherein a section of society is unable to fulfill even its basic necessities of life. The UN Human Rights Council has defined poverty as “A human condition characterized by the sustained or chronic deprivation of the resources, capabilities, choices, security and power necessary for the enjoyment of an adequate standard of living and other civil, cultural, economic, political and social rights”.
- The poor are those who live Below the Poverty Line (BPL). The poverty line is defined in terms of per capita household expenditure. Poverty manifests itself in the form of both absolute poverty as well as relative poverty.
Causes of Poverty:
The extent of poverty in an economy is due to a wide range of factors as follows:
- Underdeveloped nature of economy.
- Rapid growth of population in an overpopulated country; even if the national income increases, the per capita income remains the same due to increase in population.
- Large inequalities in the ownership of earning assets such as land, buildings, industry etc.
- Low level of productivity in agriculture and industry.
- Large scale unemployment and under-employment.
- Inequality of opportunity in acquiring education and skills.
- State Policies.
- Regional disparities.
Types of Poverty:
Absolute Poverty: This concept is based on absolute needs of the people and people are defined as poor when some absolute needs are not sufficiently satisfied. It is also defined in terms of insufficiency of basic needs. In India, these basic needs are measured in terms of calorie intake of 2400 in rural areas per person per day and 2100 in urban areas. The corresponding monetary yardstick for calorie intake is based on per capita monthly household expenditure.
Relative Poverty: This concept is related to the general standard of living in a society. Thus, according to this concept, people are poor because they are deprived of the opportunities, comforts and self-respect regarded as normal in the community to which they belong. In relative poverty, poor are defined as, a person or family whose incomes are less than the average income of the community. Thus, Relative Poverty relates to inequalities in a society. India is characterised by both in extreme measures, i.e., absolute and relative poverty.
Situational Poverty: It is a temporary type of poverty based on occurrence of an adverse event like environmental disaster, job loss and severe health problem. People can help themselves even with a small assistance, as the poverty comes because of unfortunate events.
Generational Poverty: It is handed over to individual and families from one generation to the another. This is more complicated as there is no escape because the people are trapped in its cause and unable to access the tools required to get out of it.
Rural Poverty: It occurs in rural areas with population below 50,000. It is the area where there are less job opportunities, less access to services, less support for disabilities and quality education opportunities. People are tending to live mostly on the farming and other menial work available to the surroundings.
Poverty line basket:
Determining composition of the basket is among most debated part of the issue. To make a living people consume innumerable items. Apart from food; housing, fuel, health, education, communication, conveyance, entertainment/recreations are the things which are important. But whether they should be included or not, if so their weights in basket, whether health should get preference over housing, or whether reasonable expenditure on recreation be included in basket etc. are toughest questions to be answered. Problem is that these are qualitative aspects, which are needed to be quantified.
Poverty in India:
2000s onwards:
- The Saxena Committee report, using data from 1972 to 2000, separated calorific intake apart from nominal income in its economic analysis of poverty in India, and then stated that 50% of Indians lived below the poverty line. The Planning Commission of India, in contrast, determined that the poverty rate was 39%.
- The Suresh Tendulkar Committee set up to look into the people living under the poverty line in India submitted its report in November 2009. It provided a new method of calculating the poverty line based on per capita consumption expenditure per month or day. For rural areas, it was Rs 816 per month or Rs 27 per day. For urban areas, it was Rs 1000 per month or Rs 33 per day. Using this methodology, the population below the poverty line in 2009-2010 was 354 million (29.6% of the population) and that in 2011-2012 was 269 million (21.9% of the population).
- The Rangarajan Committee set up to look into the poverty line estimation in India submitted its report in June 2014. It amended the calculation of the poverty line based on per capita consumption expenditure per month or day given by the Tendulkar Committee. The new poverty threshold for rural areas was fixed at Rs 972 per month or Rs 32 per day. For urban areas, it was fixed at Rs 1407 per month or Rs 47 per day.
- Under this methodology, the population below the poverty line in 2009-2010 was 454 million (38.2% of the population) and that in 2011-2012 was 363 million (29.5% of the population).
Anti-Poverty Strategy:
- Inclusive growth
- Financial Inclusion
Major Reasons for Failure of Poverty Alleviation Programmes:
- Planning process is faulty
- Identifying the ‘poor’
- Defining ‘poor’
- Processing of the identification involves too many stages.
- Lack of technology up gradation.
- Ideally the programs should be broader based. (benefitting the large number of people).
- Disjointed programs- not integrated. (Beneficiaries overlap, the same rural areas benefited from served programs.)
- Implementation of programs:
- Corrupt officials/ staffs.
- Lack of involvement of people.
- Local politics. (selection of beneficiaries)
- Improper follow up of program/ review or revision is practically none existed.
- Lack of support from the credit and marketing system:
- Role of local money lenders and banks.
- Inability to sustain income generation from the asset credited.
Steps Needed:
- Adopt a comprehensive reform approach to further lower the incidence of poverty and reverse the pattern of growing inequality. This multi-dimensional approach must include education, health care and labour market reforms.
- Enhance the cost effectiveness properties of the MGNREGA, by ensuring that the wage is set at a level around the minimum wage.
- Re-target environmentally harmful subsidies, to more directly support poor households and increase equity.
- Tackle regulatory and infrastructure barriers still preventing small towns from realising their potential.
Unemployment
Concept: Unemployment is a situation when a capable and willing to do job workforce does not get work.
Phillips Curve
It is a graphic curve which advocates a relationship between inflation and unemployment in an economy. As per the curve there is a ‘trade of’ between inflation and unemployment, i.e., an inverse relationship between them. The curve suggests that lower the inflation, higher the unemployment and higher the inflation, lower the unemployment.
Business Cycle
The business cycle describes the rise and falling production output of goods and services in an economy.
Types of Unemployment:
- Cyclical Unemployment: It is caused due to business cycle. This kind of an unemployment occurs when all those who want to work cannot be employed because there is not enough demand in the market for their work. It is called as, cyclical unemployment because it varies with the trade cycle.
- Frictional Unemployment: This kind of unemployment occurs when a person leaves/loses a job and starts looking for another one. This search for a job may take a considerable amount of time resulting in frictional unemployment. Frictional unemployment tends to be on a high when an economy is not doing so well and low otherwise because during good times it will be easier for people to find jobs that match their skills and requirements easily.
- Seasonal Unemployment: This kind of unemployment is expected to occur at certain parts of the year. For example, the jobs at a hill station may experiences seasonal unemployment during the winter months because less people will visit these areas during this time.
- Structural Unemployment: This kind of unemployment happens when the structure of an industry changes. For example, as the country is tending to move from use of bicycles to motorbikes and cars, the demand for labor in the cycle industry has continuously fallen in the country.
- Full Employment: Employment would be full literally when every able-bodied adult works the number of hours considered normal for a fully employed person.
- Under Employment: This term can be used in multiple connotations but one of the primary usage is to showcase a situation where a person with high skills works in low wage and low skills job.
- Disguised Unemployment: Such type of unemployment is quite common in the agri-cultural sector in India. It occurs when people are employed in a job where their presence or absence does not make any difference to the output of the economy.
Nature of Unemployment in India:
India being a developing country, the nature of unemployment therefore is in stark contrast to the one observed in the developed countries. In developed countries, unemployment is driven by a fall in demand because as the demand for goods and services, machines fall idle and the demand for labour goes down. But in India, the bigger problem is that of under-employment or disguised unemployment, which is not due to the lack of demand for goods but due to the shortage of capital equipment etc. in the economy. Because of lack of capital stock, India has not been able to commensurately meet the needs of the growing labour force in the country.
This manifests itself in two ways:
- The prevalence of large scale unemployment in the urban areas.
- In rural areas the growing numbers engaging themselves in the agricultural sector resulting in disguised unemployment.
As per one of NSS data 8.5 million people in the rural areas and 1.2 million people in the urban areas work for less than 14 hours a week resulting in underemployment.
Solution:
The basic solution to the entire problem is faster rate of capital formation so as to enlarge employment opportunities. For this the government needs to encourage savings and their productive utilization in increasing the rate of investment. The state itself can participate in the process of capital formation by undertaking such development activities as the private entrepreneurs do not find it profitable to undertake. There is also a need for the government to increase and attract more foreign investment in a country like India.
Social Infrastructure:
What is Social Infrastructure?
Infrastructure can broadly be defined as long-term physical assets that operate in markets with high barriers to entry and enable the provision of goods and services. Social services include, education, sports, art and culture; medical and public health, family welfare, water supply and sanitation, housing; urban development; welfare of Schedule Castes (SCs), Schedule Tribes (STs) and Other Backward Castes (OBCs), labour and labour welfare; social security and welfare, nutrition, relief on account of natural calamities etc. Expenditure on ‘Education’ pertains to expenditure on ‘Education, Sports, Arts and Culture’.
Status of Social Sector in India:
The expenditure on social infrastructure like health and education is a critical indicator of the commitment of the government towards these sectors. Public investment in social infrastructure has a critical role in providing access to social services for the people, especially the marginal and vulnerable sections of the society. The expenditure on social services by the Centre and States as a proportion of Gross Domestic Product (GDP) has registered an increase of more than 1 percentage points during the period 2014-15 to 2018-19 (BE), from 6.2 per cent in 2014- 15 to 7.3 per cent in 2018-19 (BE). The increase was witnessed across all social sectors especially education where the public expenditure as a per cent of GDP increased from 2.8 per cent in 2014-15 to 3 per cent in 2018-19. The share of expenditure on social services out of total budgetary expenditure increased from 24.9 per cent in 2013-14 to 26 per cent in 2018-19.
- Education in India: As per Educational Statistics at a Glance (ESAG), 2018, the thrust on providing primary education has yielded results across social categories and gender in Gross Enrollment Rate (GER). Over the years, remarkable progress has been made in respect of female participation up-to secondary level and GER for girls has exceeded that of boys. But girls’ enrollment rate is lower than that of boys at the higher education level. At this level, the gap is visible across the social categories too. The Pupil Teacher Ratio (PTR) at national level for primary schools is 23, 17 for upper primary, 27 for secondary and 37 for senior secondary schools.
- Gender Parity Index (GPI) based on GER: GPI based on GER indicates increasing trend of female participation at all levels. At the higher education level the GPI is low. Although, enrolment of girls is higher than that of boys in government schools, the pattern gets reversed in private schools. The gender gap in enrollment in private schools has consistently increased across age groups.
- Status of Health: Public health expenditure (centre, states and local bodies), as a percentage of Total Health Expenditure (THE) increased from 22.5 per cent in 2004-05 to 30.6 per cent in 2015-16. The National Health Mission (NHM), with its two sub-missions National Urban Health Mission (NUHM) and National Rural Health Mission (NRHM) envisages achievement of universal access to equitable, affordable and quality healthcare services that are accountable and responsive to peoples’ needs. Under this Mission, support is provided to States/UTs to provide accessible, affordable, accountable and effective healthcare up to District Hospital level. Major programme components under NRHM are Reproductive-Maternal- Neonatal-Child and Adolescent Health and Communicable and Non- Communicable diseases.
- Skill Development: The schooling system improves the educational level of the population. It is skill training that equip the youth to enter the labour market and improves their employability. According to NSSO Report 2011-12, only 2.3 per cent of the total workforce in India had formal sector skill training. Keeping in view the predominance of young population, the government had formulated the National Policy on Skill Development & Entrepreneurship, 2015 under which the Skill India Mission by 2022 was formulated.
Government Initiatives:
The government has been committed to provision of social security which is evident in the initiation of major social sector schemes by the Government of India during the last five years given below:
- Pradhan Mantri Suraksha Bima Yojana, 2015 - It offers a one-year accidental death and disability cover with annual premium of Rs. 12. It is available to people in the age group 18 to 70 years.
- Pradhan Mantri Jeevan Jyoti Bima Yojana, 2015 - It is government-backed life insurance scheme with annual premium of Rs. 330. It is available to people between 18 and 50 years of age.
- Pradhan Mantri Vaya Vandana Yojana, 2018 - It is a pension scheme exclusively for the senior citizens aged 60 years and above.
- PM-KISAN, 2019 - It offers income support of Rs. 6000 per annum in three equal instalments to all eligible farmers irrespective of land holdings.
- National Nutrition Mission (POSHAN Abhiyaan) - It ensure attainment of malnutrition free India by 2022. Targeted intervention in areas with high malnutrition burden.
- Skilling Ecosystem - Skilling ecosystem in India is equipping the youth to meet the challenges of a dynamic labour market by providing various short term and long term skilling under programmes like 'Pradhan Mantri Kaushal Vikas Yojana' (PMKVY). PMKVY has had positive impact on employment and incomes of the youth as per evaluation studies.
- Rural Infrastructure - Connectivity is critical for rural areas to improve quality of lives of the poor by enhancing access to various social services, education, health and access to markets. PMGSY has played a crucial role in connecting the unconnected in rural India and enhanced their livelihood opportunities. Government has accorded highest priority to rural housing, by providing dwelling with all basic facilities to the most needy under Pradhan Mantri Awas Yojana (Gramin) (PMAY-G). Government has also prioritized employment programmes like MGNREGS which is reflected in the upward trend in budget allocation and release of funds to the States in the last four years.
- Financial Inclusion - Financial inclusion of women is considered as an essential tool for empowerment of women as it enhances their self confidence and enables financial decision-making to a certain extent. As far as financial inclusion in India is concerned, significant progress has been made during the last decade. At all India level, the proportion of women having a bank or saving account that they themselves use have increased from 15.5 per cent in 2005-06 to 53 per cent in 2015-16.
Way Forward:
- India's development trajectory is critically intertwined with the investments in social infrastructure. To reap the benefits of demographic dividend, the government is committed to improve the outcomes in education and skilling and to provide employment and affordable healthcare to all.
- Scaling up development programmes for improving connectivity, providing housing and bridging gender gaps in socio-economic indicators is of paramount importance for sustainable development. India's march towards achieving SDGs is firmly anchored in investing in human capital and inclusive growth.
- Inclusiveness has been the cornerstone of India’s development agenda. As India is a developing economy with resource constraints, we have to prioritize and optimize the expenditure on social infrastructure to promote sustainable and inclusive growth.
Thalinomics
Context
The Economic Survey 2020 coined a new term called ‘Thalinomics’ and the government pitched the term as “economics for the common man”.
About
- The Economic Survey 2020 made a unique attempt to quantify the cost incurred in putting together one complete home-made meal — the healthy Indian thali.
- Thali prices represent the total money spent on preparing dishes for a meal in a household.
- Thalinomics captures the economics of a plate of food in India.
- Rise in Affordability: Despite recent concerns about rising food prices, the Economic Survey has stated that for a worker, a vegetarian thali is 29% more affordable since 2006-07. And affordability of a non-vegetarian thali improved by 18 per cent.
- It also looked at an industrial worker’s ability to pay for two thalis a day for his/her household of five individuals.
- Conclusion: Basically the survey attempts to calculate the cost that an average worker incurs based on his actual plate of food in India.
- And on calculating that cost, the survey concludes that works were able to save due to moderation in prices of items that form part of a regular Indian thali.
Food inflation trends
Food inflation based on CPI declined to a low of 0.1% in 2018-19 against 1.8% in 2017-18, 4.2% in 2016-17 and 4.9% in 2015-16. However, the government revised the inflation projection from 3.5- 3.7% in the second half of 2019-20 to 4.7-5.1%.
Calculations
- The analysis is based on data on prices taken from the Consumer Price Index for Industrial Workers(CPI IW) for around 80 centres in 25 States/UTs from April 2006 to October 2019.
- The survey took into account the prices of cereals(rice/ wheat), sabzi (vegetables, other ingredients), dal (pulses with other ingredients) as well as the cost of fuel.
- In a non-vegetarian thali, pulses are replaced by 60 gm of non-vegetarian components keeping in mind prices of eggs, fresh fish and goat meat.
- It also took into consideration prices of ingredients such as spices and condiments such as mustard oil, coconut oil and groundnut oil, turmeric and chillies.
- For fuel, cooking gas prices as well as firewood prices were taken into consideration.
State-wise performance
- Across the board gains: Both across India and the four regions– North, South, East and West – we find that the absolute prices of a vegetarian Thali have decreased since 2015-16 though it increased during 2019.
- Exception: Gains are observed across regions, with the exception of the Northern Region and Eastern Region in 2016-17 in the case of vegetarian Thali.
- Southern region with highest gains: The highest gain in any year was in the Southern region for a vegetarian Thali in 2018-19 of around 12 per cent of annual earnings of a worker.
- Jharkhand thali the cheapest: Jharkhand emerged as the State with cheapest vegetarian thali during April-October 2019.
- Two vegetarian thalis for a household of five in Jharkhand required about 25 per cent of a worker’s daily wage.
Results from Thalinomics
- Gains: After 2015-16, an average household of five individuals that eats two vegetarian thalis a day gained around ?10,887 on average per year, while a non-vegetarian household gained ?11,787 on average per year.
- Gains here are spends that households saved on due to moderation in the prices of commodities.
- A worker who would have spent 70%of their daily wage on two vegetarian thalis a day for a household of five in 2006-07, would only have to spend 50% of their income for the meals in 2019-20.
- Fall in prices: Survey said there was a shift in the dynamics of thali prices from 2015-16. Gains are due to significant moderation in prices of vegetables and dal from 2015-16 when compared to the previous trend of increasing prices.
- Reasons for gains due to reform measures: Many reform measures were introduced during the period of analysis to enhance the productivity of the agricultural sector as well as efficiency and effectiveness of agricultural markets for better and more transparent price discovery:
- Pradhan Mantri Annadata Aay SanraksHan Abhiyan (PM-AASHA).
- Pradhan Mantri Krishi Sinchayee Yojana (PMKSY) - Per Drop More Crop.
- Pradhan Mantri Fasal Bima Yojana (PMFBY).
- Soil Health Card.
- E-National Agricultural Market (e-NAM).
- National Food Security Mission (NFSM).
- National Food Security Act (NFSA).
- Recent trend is inflationary: Survey shows that accelerating food inflation over the last few months has broken the earlier trend.
- Workers are now forced to use an increasing share of their wages on food.
Challenges
- Small sample size:The calculations deal with workers engaged in the organised manufacturing sector, which form only 28% of the total manufacturing workforce.
- It excludes workers from the unorganised sector, as well as rural and agricultural workers.
- Fall in incomes: While it is true that there was a decline in food prices during most of the period since 2015-16, this is also a period of stagnant or declining rural wages and highest unemployment.
- Low inflation is meaningless when real wages are falling in rural areas, as this means that the poor are not able to consume more as their incomes are falling.
Remission of duties or taxes on export product
Context
Recently, government launched a new scheme called Remission of Duties and Taxes on Export Product (RoDTEP).
About
- Remission of Duties and Taxes on Export Product (RoDTEP): RoDTEP is a Rs 50,000-crore exports programme which is supposed to replace Merchandise Exports From India Scheme (MEIS).
- Operation delayed:The operation of RoDTEP was recently delayed. MEIS would remain in force till March 31, 2020.
- RoDTEP was first set to roll-out from 1st January 2020, but recently its roll-out was delayed to next fiscal.
- This delay was done at the behest of exporters’ request to grant them more time to prepare for a transition from MEIS to the new scheme, given the operational challenges.
- The next foreign trade policy will contain the broad contours of RoDTEP.
MEIS was WTO-incompatible
- MEIS was introduced in the Foreign Trade Policy (FTP) 2015-20 w.e.f. 1st April 2015.
- Objective: Its objective was to offset infrastructural inefficiencies and associated costs involved in exporting goods which are manufactured in India, including products manufactured by the MSME Sector.
- WTO-incompatible: World Trade Organisation (WTO) panel had determined that India’s export subsidies are inconsistent with WTO requirements.
- The ruling of WTO’s Disputes Settlement Body (DSB)in favour of US against India’s export “subsidies” is still pending.
- US claims that India offers illegal export subsidies and thousands of Indian companies benefit from it.
- India’s argument: India rejects claims made by the US
- The entire allocation or potential revenue forgone on account of various such schemes (including MEIS) doesn’t qualify as export subsidies.
- They are meant to only soften the blow of costly input imports that exporters have been forced to bear due to a complicated tax structure.
- Exports are in sync with the best global practices.
RoDTEP scheme
- Reimburse input taxes and duties: RoDTEP is expected to adequately incentivize exporters by reducing duties paid on exports and will initiate the refund of various taxes to exporters.
- WTO compliant: The new scheme is supposed to reimburse all taxes and duties paid on inputs consumed in exports in sync with the WTO norms.
- The MEIS, exporters have persistently complained, doesn’t offset all the taxes, so the new scheme will be beneficial to them when it’s implemented.
- Automatic refund-route:The new scheme will have a fully automated route for Input Tax Credit (ITC) in the GST to help increase exports in India.
- Avoid double taxation: ITC is provided to set off tax paid on the purchase of raw materials, consumables, goods or services that were used in the manufacturing of goods or services. This helps in avoiding double taxation and the cascading effect of taxes
- Attempt to reverse export fall:It is expected to adequately incentivize exporters by reducing duties paid on exports and will initiate the refund of various taxes to exporters. Measures in the new scheme include:
- Easier priority-sector lending norms for exports
- Greater insurance cover under ECGC
- Lower premium for MSMEs to avail of such cover
- Costly to the government:Since potential revenue forgone in the current MEIS is around Rs 40,000 crore a year, RoDTEP is expected to cost the government an additional Rs 10,000 crore annually.
Additional benefits of MEIS and RoDTEP
- Both MEIS and RoDTEP seek to free up working capital of exporters.
- An electronic refund module will be set up to automatically to refund input tax credits.
- The move will increase bank credit to exporters under the Export Credit Insurance Scheme.
- Exporters will receive a higher insurance cover from banks that offer capital loans
Indian Protectionism
Context
Recent escalation of protectionist steps between US and China has raised questions about India’s policy response.
About
- After independence in 1947, India spent decades trying to survive without international trade.
- While this protection succeeded in creating a large and highly diversified industrial base, it also led to inefficiency in the use of resources.
- India ditched its model of local production for local consumption following a currency crisis in early 1990s. It open up to foreign investment and removed trade barriers in exchange of help from
- Since 1991, the tariff policy of India has led to a systemic reduction in India’s weighted effective average tariff.
- Decline in average tariff has coincided with a sharp rise in GDP and higher growth rate. Lower tariffs offered following few benefits:
- Rise in exports and reduction in poverty at the fastest pace in India’s history.
- India emerged as a leader in exports of IT services, and is now a key player in
- It also helped India run a trade surplus- whereby it sells more than it buys - in goods and services with US.
- Trade liberalization fostered an atmosphere of intense competition, leading to better use of inputs and innovation, driving productivity growth.
- Current Scenario: Recent trade experience has been mixed.
- Export growth is slow paced.
- The current economic slowdown has led to a drop in the value of imports, thus shrinking the current account deficit.
|
“Infant industry" argument
|
India a “tariff King” and growing protectionism
- A few months back, President Donald Trump described India as “the tariff king", accusing it of imposing “tremendously high" tariffs on American products.
- When higher tariffs are supplemented by higher current account deficit and fall in rupee, they reinforce a growing trend of protectionism.
- India is among the most heavily protected economies in the world:
- Among members of BRICS grouping—Brazil, Russia, India, China, South Africa—India has the highest effective tariff rates on food items, automobiles and industrial inputs.
- Data from the Global Trade Alert (GTA) database shows that India and the US introduced the most trade restrictions in 2018.
- Number of harmful interventions implemented by India has increased in last decade.
- A recent World Bank report accused India of increasingly resorting to trade remedy measures such as anti-dumping and safeguard actions.
- In its latest report on global trade barriers, the US trade department singled out India as having the highest tariffs "of any major world economy" - averaging 13.8%.
- While import tariffs may provide the economy with short-term relief, growing protectionism can have long term adverse consequences.
Case against growing protectionism
- At a time when other economies are also raising trade barriers, it is easy to fall into the protectionist trap.
- Will undo trade liberalisation benefits: India’s trend to protectionism threatens to undo more than two decades of trade liberalization measures that have powered India’s growth over the past quarter century, boosting incomes and helping cut poverty levels.
- Will be hardest hit: A recent OECD report warned that India, Australia and China would be the biggest losers in terms of per-capita income growth if the current wave of trade protectionism escalates and slows down global growth.
Higher tariffs do not aid Make in India
- Disincentive competition: There is adequate empirical evidence, including India’s experience, that suggests protectionism and tariff barriers act as a disincentive for domestic industries to become competitive.
- Higher input cost: A higher tariff on imported inputs result in higher input costs for manufacturers, which could otherwise be competitive if they could import cheaper inputs.
- Hence, a comprehensive view of the supply chain must be taken while making any changes to tariff policies.
- High-level advisory group suggestions: Amidst US-China trade war, it is possible that higher tariffs might be imposed by other countries on Indian goods and services. It would be beneficial for India does not retaliate with tariffs.
- Any move to raise tariffs must consider the integrated supply chains and the fact that Indian imports are largely for domestic consumption.
Suggested policy response
- As production takes place through supply chains, India should integrate with global markets to ensure adequate labour-intensive manufacturing jobs.
- As India has a natural comparative advantage in labour-intensive economic activities, such activities should benefit from provision of adequate infrastructure for manufacturing and the elimination or reform of crippling anti-business labour laws.
- Tariffs can be part of a revenue-raising strategy, but it is better to have a small, uniform (same for all goods) tariff, rather than large tariffs in seemingly arbitrary sectors.
- This would help avoid the problem of “effective" rate of protection deviating from the nominal rate, and the possible worsening of the problem of tariff inversion.
|
Effective rate of protection (ERP): In economics, ERP is a measure of total effect of the entire tariff structure on the value added per unit of output in each industry, when both intermediate and final goods are imported. Nominal rate of protection (NRP): NRP is the percentage tariff imposed on a product as it enters the country. Tariff inversion: It is a case where tariffs on intermediate inputs are higher than tariffs on final goods, making domestic production inefficient. |
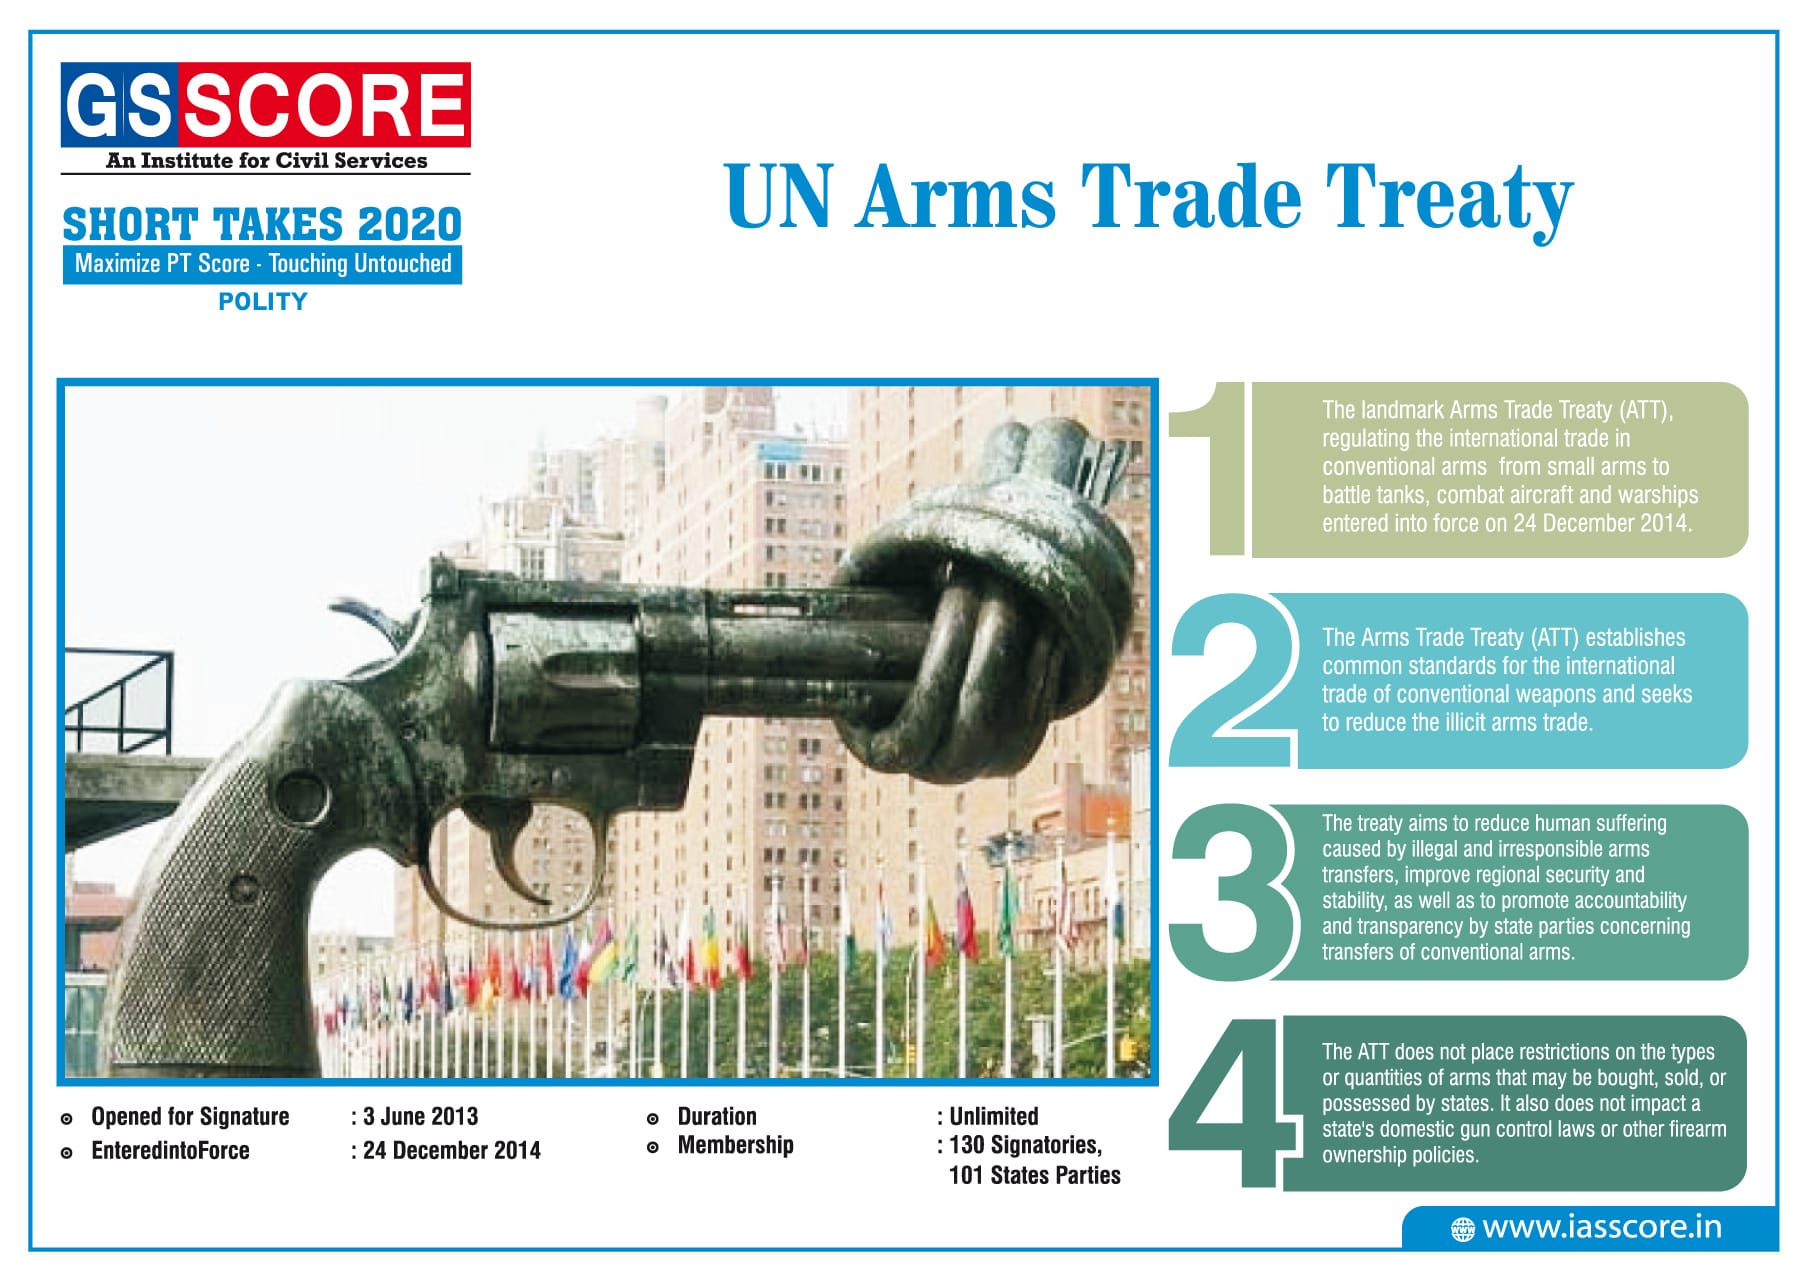
UN Arms Trade Treaty
UNESCO Creative Cities Network (UCCN)
-min.jpg)
National Commission for Scheduled Castes (NCSC)
-min.jpg)
CLAWS

New Department of Military Affairs