Geography: Oceanography
Oceanography
Around 70% of the Earth’s surface is covered by oceans. The average depth of the world’s oceans is 12,200 feet. About 70% of the oxygen we breathe is produced by the oceans. Around 97 percent of the planets water is in the oceans. Around 80 percent of the world’s population lives within 60 miles of the ocean coast. The largest ocean on Earth is the Pacific Ocean, covering around 30% of the Earth’s surface. The deepest known area of the Earth’s oceans is known as the Mariana Trench. It’s deepest point measures 11km. The longest mountain range in the world is found under water. Stretching over 56,000km, the Mid-Oceanic Ridge is a mountain chain that runs along the centre of the ocean basins. The mountain Mauna Kea in Hawaii rises 33,474 feet from its base. This would make it the tallest mountain in the world if its base wasn’t below sea level. The sea is home to the world’s largest living structure – the Great Barrier Reef. Measuring around 2,600km, it can even be seen from the Moon!
Major Division of Ocean Hour
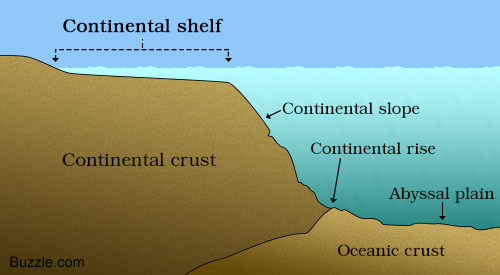
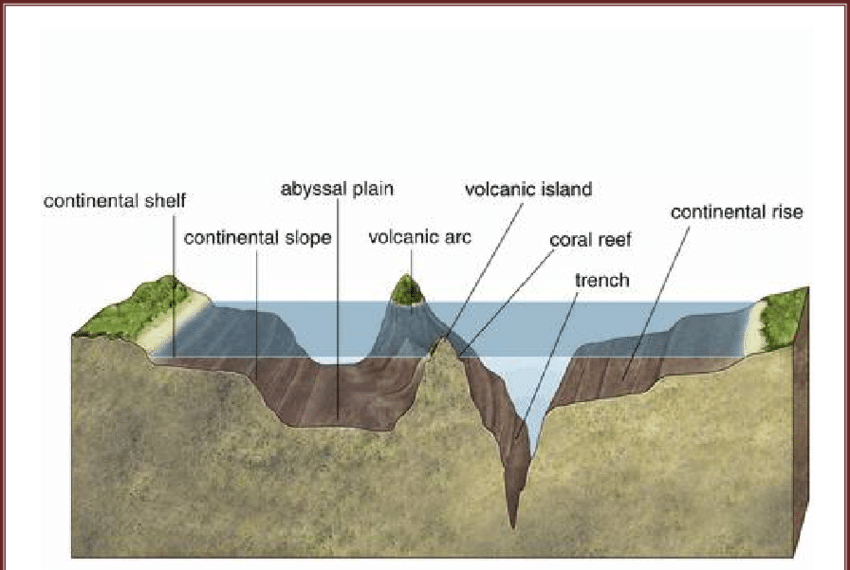
- Four major divisions can easily be identified on the ocean floor-
- The Continental Shelf
- The Continental Slope
- The Continental Rise
- The Abyssal Plain.
- Besides these, there are many associated features-ridges, hills, seamounts, guyots, trenches, canyons, sleeps, fracture zones, island arcs, atolls, coral reefs, submerged volcanoes and sea-scarps.
- This great variety of relief is largely due to interaction of tectonic, volcanic, erosional and depositional processes.
- At greater depths, the tectonic and volcanic phenomena are more significant processes.
Continental Shelf
- This is a gentle seaward sloping surface extending from the coasts towards the open sea. In all, about 7.5% of the total area of the oceans is covered by the continental shelves. The shelf is formed by the drowning of a part of a continent with a relative rise in sea level or marine deposition beneath the water.
- The average width of the continental shelf is about 70 km and mean slope is less than one degree, but the width shows great variety from location to location. For instance, it is almost absent in the eastern Pacific, especially of South America and is upto 120 km wide along the eastern coast of USA. The seaward edge of the shelf is usually 150-200 metres deep.
- The continental shelves are mostly covered by sediments of terrestrial origin. There are various types of shelves-glaciated shelf, coral reef shelf, and shelf of a large river, shelf with dendritic valleys and the shelf along young mountain ranges.
Continental Slope
- Marking the seaward edge of the continental shelf is the Continental Slope. This slope is steeper than the shelf, and it marks the boundary between continental crust and oceanic crust. Although the steepness of the continental slope varies greatly from place to place, it averages about 5 degrees. In some places the slope may exceed 25 degrees. The continental slope is a relatively narrow feature, averaging only about 20 kilometers in width.
- Deep, steep-sided valleys known as submarine canyons are cut into the continental slope. These canyons may extend to the ocean basin floor. Submarine canyons have been eroded, at least in part, by turbidity currents.
- Turbidity currents are occasional movements of dense, sediment-rich water down the continental slope.
- They are created when sand and mud on the continental shelf and slope are disturbed-perhaps by an earthquake-and become suspended in the water. Because such muddy water is denser than normal seawater, it flows down the slope. As it flows down, it erodes and accumulates more sediment. Erosion from these muddy torrents is believed to be the major force in the formation of most submarine canyons. Narrow continental margins, such as the one located along the California coast, are marked with numerous submarine canyons.
- Turbidity currents are known to be an important mechanism of sediment transport in the ocean. Turbidity currents erode submarine canyons and deposit sediments on the deep-ocean floor.
Continental Rise
- Continental rise, a major depositional regime in oceans made up of thick sequences of continental material that accumulate between the continental slope and the abyssal plain. Continental Rises form as a result of three sedimentary processes: mass wasting, the deposition from contour currents, and the vertical settling of clastic and biogenic particles.
- The continental slope gradually loses its steepness with depth. When the slope reaches a level of between 0.5° and 1°, it is referred to as the continental rise. With increasing depth the rise becomes virtually fat and merges with the abyssal plain.
Abyssal Plains
- Beyond the continental rise, at depths from 3,000 m to 6,000 m, lie the deep sea plains, called abyssal plains or abyssal floors. Covering nearly 40% of the ocean floor, the abyssal plains are present in all major oceans and several seas of the world. They are uniquely fat with a gradient of less than 10,000. The large supply of terrigenous and shallow water sediments buries the irregular topography to form a generally fat relief.
Other Features
Submarine Ridges
- Submarine ridges are mountain ranges, a few hundred kilometres wide and hundreds and often thousands of kilometres in length on the floors of oceans. Running for a total length of 75,000 km, these ridges form the largest mountain systems on earth.
- These ridges are either broad, like a plateau, gently sloped or in the form of steep-sided narrow mountains. These oceanic ridge systems are of tectonic origin and provide evidence in support of the theory of Plate Tectonics.
Abyssal Hills
- These are elevated features of volcanic origin. A submarine mountain or peak rising more than 1,000 metres above the ocean floor is known as a seamount. The fat topped mountains are known as guyots.
- Seamounts and guyots are very common in the Pacific Ocean, where they are estimated to number around 10,000.
Submarine Trenches or Deeps
- These are the deepest parts of the oceans with their bottoms far below the average level of the ocean floors. A trench is a long, narrow and steep-sided depression on the ocean bottom, which is usually 5,500 metres in depth. The trenches lie along the fringes of the deep-sea plain and run parallel to the bordering fold mountains or the island chains.
- They are believed to have resulted from down faulting or down folding of the earth’s crust and are, therefore, of tectonic origin. The trenches are very common in the Pacific Ocean and form an almost continuous ring along the western and eastern margins of the Pacific. The Mariana Trench of the Guam Islands in the Pacific Ocean is the deepest trench with a depth of more than 11 kilometers.
- These are steep valleys, forming deep gorges on the ocean floor. They are mainly restricted to the continental shelf, slope and rise.
Submarine Canyons
- Small gorges which begin at the edge of the continental shelf and extend down the slope to very great depths, e.g. Oceanographer Canyons near New England.
- Those which begin at the mouth of a river and extend over the shelf, such as the Zaire, the Mississippi and the Indus canyons.
- Those which have a dendritic appearance and are deeply cut into the edge of the shelf and the slope, like the canyons of the coast of southern California. The Hudson Canyon is the best known canyon in the world. The largest canyons in the world occur in the Bering Sea of Alaska. They are the Bering, Pribilof and Zhemchung canyons.
Temperature and Salinity of Ocean Waters
With increasing depth the temperature of the ocean water decreases. At great depths the temperature goes well beyond 0ºC. The top part of the ocean water is called the surface layer. Then there is a boundary layer called the thermocline layer. The thermocline layer separates the surface layers and the deep water of the ocean.
Temperature and Density of Ocean Water
- The temperature of the world’s ocean is highly variable over the surface of the oceans, ranging from less than 0°C (32°F) near the poles to more than 29°C (84°F) in the tropics. It is heated from the surface downward by sunlight, but at depth most of the ocean is very cold. Seventy five percent of the water in the ocean falls within the temperature range of +1 to +6°C (30 to 43°F) and the salinity range of 34% to 35%.
- Variations in total salinity and in temperature cause variations in the density of sea water. Several factors can cause the salinity to deviate from 35%. Addition of river water or rainwater decreases salinity; excess evaporation or formation of pack ice causes salinity to increase (because ice crystals themselves do not contain salt- the salt is expelled to cracks and pores between the crystals).
- The density of a water sample is a measure of the total mass in a given unit volume. Salinity increases the density because the dissolved salts are contained in the same volume as the water. Water molecules cluster more closely around positive and negative ions in solution in a process called electrostriction, which also serves to increase sea water density.
- At depth, pressure from the overlying ocean water becomes very high (pressure at 4,000 meters is about 400 atmospheric pressure), but water is only slightly compressible, so that there is only a minor pressure effect on density. At a depth of 4,000 meters, water decreases in volume only by 1.8 percent. Although the high pressure at depth has only a slight effect on the water, it has a much greater effect on easily compressible materials.
Distribution of Ocean Water Temperature
The horizontal distribution of the temperature of ocean water depends upon the following factors: Latitudinal Distance: Temperature of the ocean water decreases as we move away from the equator. The average temperature of ocean water is 26°C in open seas at equator but the temperature decreases to 23°C at 20° North and South latitudes. Temperature further decreases to 14°C at 40° latitudes and to 1°C at 60° latitudes.
Change of Season: The effect of season is far more pronounced in air than in water. Ocean water records a seasonal range of only 1.2° between 20° and 30° latitudes. The range is still 1.2°C beyond 50° latitudes. The greatest range is found near New Foundland (4.5°C).
Enclosed Seas: The highest temperature of ocean water is found in enclosed or partially enclosed seas in tropical areas. For example a temperature of 38°C has been recorded in Red Sea though the average temperature in summer is only 29°C.
The Effect of Ocean Currents: The temperature of warm current is higher than that of the surrounding areas. The warm currents keep the coastal lands warmer. For example, the Gulf Stream does not allow the Norway Coast to freeze even in winter and thus helps the development of trade and commerce in that country. The temperature between Davis Strait and New Found land drops down because of cold Labrador Current washing the coasts.
Prevailing Winds: The prevailing winds deflect the warm and cold currents and causes change in temperature of ocean water. For example, the currents on the east coast in the Trade Wind Belt shift away from the coast. Hence, the warm currents flowing along the coast moves away from it which leads to the upwelling of cold water from below near the coast. Hence the temperature remains low in spite of the passage of warm currents. This is why the temperature remains lower on the eastern than on western parts of the oceans.
The effect of Land Masses: The small seas are affected by the adjacent land masses. The temperature rises in summer and falls in winter because of the influence of the land masses.
Iceberg: Icebergs are found near polar areas and can be seen to be floating up to 50° latitudes. One part of iceberg is above sea and eight parts remain submerged under sea water. Many icebergs have a height of hundreds of metres above sea level. Thousands of icebergs can be seen moving away from North Atlantic. The Falkland and Beneguela currents carry them too far of places. It lowers the temperature of the water at great depth.
Vertical Distribution of Temperature
When the sun’s rays fall over the ocean water, they penetrate into it and hence their strength is reduced by scattering, reflection and diffusion. There is decrease in temperature with increase in depth. But, the rate of decrease in the temperature is not uniform at all depths. Up to a depth of about 10 metres, the temperature of water is about the same as that of the surface, while it falls from about 15°C to about 2°C between the surface and a depth of 1800 metres, and the decrease between 1800 to 4000 metres is from 2°C to about 1.6°C. The rate of decrease is greater at the equator than at the poles.
The factors affecting vertical distributions of temperature are:
- Upwelling of cold water.
- Sinking of dense surface water.
- Cold and warm currents.
- Regional Insolation.
- Submarine topography.
- Open and enclosed seas.
Salinity of Ocean Waters
The salinity of water is usually expressed in parts per thousand by weight (%) and is due to the presence of compounds of sodium, potassium, magnesium, calcium and other elements including a high proportion of sodium chloride (common salt). Rivers derive minerals from rocks and carry them to the sea. The salinity varies with the amounts of salts contributed, addition of fresh water by rainfall, rivers, and melting ice, and also with the rate of evaporation: rapid evaporation can cause relatively high surface salinity in open oceans.
- The average salinity of sea water is 35% (thirty five part per thousand).
- The lines on maps joining places of equal salinity at surface are known as Isohalines.
Lakes with highest salinity
- Great Salt Lake: 220%
- Dead Sea : 240%
- Lake Van (Turkey): 330%
Composition of Sea Water
- Sodium Chlorate - 77.5%
- Magnesium Chloride - 10.9%
- Magnesium Sulphate - 4.7%
- Calcium Sulphate - 3.6%
- Potassium Sulphate - 2.5%
- Calcium Carbonate - 0.3%
- Magnesium Bromide - 0.2%
Reasons for the Varying Salinity of the Sea Water
Evaporation and Precipitation
- Evaporation causes concentration of salt. Highest salinity is found near the tropics, because of active evaporation owing to clear sky, high temperature and steady trade winds. Salinity decreases towards the equator because of heavier rainfall. In the Atlantic Ocean the salinity near the tropics is 37% and near the equator it is only 35%.
Stream run of
- The areas which receive fresh water by rivers have low salinity, e.g., huge amount of fresh water brought by the Danube, the Dnieper and the Don into the Black Sea reduces its salinity to 17%.
Freezing and Melting of Ice
- In the polar areas, there is very little evaporation and this coupled with the melting of ice, yielding fresh water, leads to a decrease in salinity, usually between 20% and 32%.
Atmospheric Pressure and Wind Direction
- Salinity changes slightly due to winds resulting from differences in atmospheric pressure. Of the Californian coast, North East Trade winds carry the warm saline water far of the coast and consequently colder and less saline water start upwelling from below.
Ocean Currents
- The currents, stirred by wind, sweep away saline water from the eastern coast of the high latitudes to the western coasts, whereas cold water penetrates into the low latitudes. Thus there is a tendency for salinity to increase from east to west. Salinity is higher in enclosed seas as compared to open seas. The salinity of the Red Sea is 40% and that of the Dead Sea is 2.28%. This is because of high rate of evaporation, lack of supply of fresh water in enclosed seas.
- The Baltic Sea receives many fresh water rivers from the neighboring shield areas, and, with a low rate of evaporation the salinity is only 2% at the head of the Gulf of Bothnia. The Mediterranean waters do not mix freely with the open ocean. In the hot, dry summers there is very rapid evaporation. The Nile is the only large river entering the eastern parts and brings down much salt, so that the salinity of the eastern Mediterranean in summer is about 40%. Further east, in the inland Dead Sea, the salinity is almost 240%, and there is salt accumulation along the shores.
- The movement of ocean waters takes place in three different forms, viz., waves, currents and tides. Ocean water moves horizontally as well as vertically.
- These movements are due to variation in density from one part to another which results from the differences in salinity and temperatures. Winds also provide a motive force for the horizontal movement of surface water. The movement of surface water in which the rise and fall of water surface is more predominant than the actual forward motion of the water particles is called waves. When the movement of a mass of water in a fairly definite direction over great distances takes place is called current. Currents are caused by the differences in salinity, drag of winds, shape and position of coasts and variation in temperature.
- Currents are of two types: Warm currents and Cold currents. Currents exert an influence on the climate of the bordering coastal regions. They provide plankton, a food for the fish. Important ocean routes follow the favorable currents. There are important currents in Pacific Ocean, the Atlantic Ocean and the Indian Ocean.
OCEANIC MOVEMENTS: WAVES, TIDES & CURRENTS
The ocean water is dynamic. Its physical characteristics like temperature, salinity, density and the external forces like of the sun, moon and the winds influence the movement of ocean water. The horizontal and vertical motions are common in ocean water bodies. The horizontal motion refers to the ocean currents and waves. The vertical motion refers to tides.
Waves
- Waves are actually the energy, not the water as such, which moves across the ocean surface. Water particles only travel in a small circle as a wave passes. Wind provides energy to the waves. Wind causes waves to travel in the ocean and the energy is released on shorelines.
- As a wave approaches the beach, it slows down. This is due to the friction occurring between the dynamic water and the sea floor. And, when the depth of water is less than half the wavelength of the wave, the wave breaks. The largest waves are found in the open oceans.
- Waves continue to grow larger as they move and absorb energy from the wind. Most of the waves are caused by the wind driving against water. When a breeze of two knots or less blows over calm water, small ripples form and grow as the wind speed increases until white caps appear in the breaking waves. Waves may travel thousands of km before rolling ashore, breaking and dissolving as surf.
- A wave’s size and shape reveal its origin. Steep waves are fairly young ones and are probably formed by local wind. Slow and steady waves originate from far away places, possibly from another hemisphere. The maximum wave height is determined by the strength of the wind, i.e. how long it blows and the area over which it blows in a single direction.
- Waves travel because wind pushes the water body in its course while gravity pulls the crests of the waves downward. The falling water pushes the former troughs upward, and the wave moves to a new position. The actual motion of the water beneath the waves is circular. It indicates that things are carried up and forward as the wave approaches, and down and back as it passes.
Tides
Tides are the periodic motion of the waters of the sea due to changes in the attractive forces of the Moon and Sun upon the rotating Earth. Basically, tides are very long-period waves that move through the oceans in response to the forces exerted by the moon and sun.
- Tides originate in the oceans and progress toward the coastlines where they appear as the regular rise and fall of the sea surface. When the highest part or crest of the wave reaches a particular location, high tide occurs; low tide corresponds to the lowest part of the wave, or its trough.
- The difference in height between the high tide and the low tide is called the tidal range. A horizontal movement of water often accompanies the rising and falling of the tide. This is called the tidal current.
- Tides can either help or hinder a mariner. A high tide may provide enough depth to clear a harbour, while a low tide may prevent entering or leaving a harbour. Tidal current may help progress or hinder it, may set the ship toward dangers or away from them.
Causes of Tides
- The principal tidal forces are generated by the Moon and Sun. The Moon is the main tide-generating body. Due to its greater distance, the Sun’s effect is only 46 percent of the Moon’s. Observed tides will differ considerably from the tides predicted by equilibrium theory since size, depth, and configuration of the basin or waterway, friction, land masses, inertia of water masses, Coriolis acceleration, and other factors are neglected in this theory. Nevertheless, equilibrium theory is sufficient to describe the magnitude and distribution of the main tide-generating forces across the surface of the Earth.
- Newton’s universal law of gravitation governs both the orbits of celestial bodies and the tide-generating forces which occur on them. The force of gravitational attraction between any two masses, m1 and m2, is given by: where d is the distance between the two masses, and G is a constant which depends upon the units employed. This law assumes that m1 and m2 are point masses. Newton was able to show that homogeneous spheres could be treated as point masses when determining their orbits.
Features of Tides
- At most places the tidal change occurs twice daily. The tide rises until it reaches a maximum height, called high tide or high water, and then falls to a minimum level called low tide or low water.
- The rate of rise and fall is not uniform. From low water, the tide begins to rise slowly at first, but at an increasing rate until it is about halfway to high water. The rate of rise then decreases until high water is reached, and the rise ceases.
- The falling tide behaves in a similar manner. The period at high or low water during which there is no apparent change of level
Types of Tides
Tides vary in their frequency, direction and movement from place to place and also from time to time. Tides may be grouped into various types based on their frequency of occurrence in one day or 24 hours or based on their height.
Tides based on Frequency
Semi-diurnal tide: The most common tidal pattern, featuring two high tides and two low tides each day. The successive high or low tides are approximately of the same height.
Diurnal tide: There is only one high tide and one low tide during each day. The successive high and low tides are approximately of the same height.
Mixed tide: Tides having variations in height are known as mixed tides. These tides generally occur along the west coast of North America and on many islands of the Pacific Ocean.
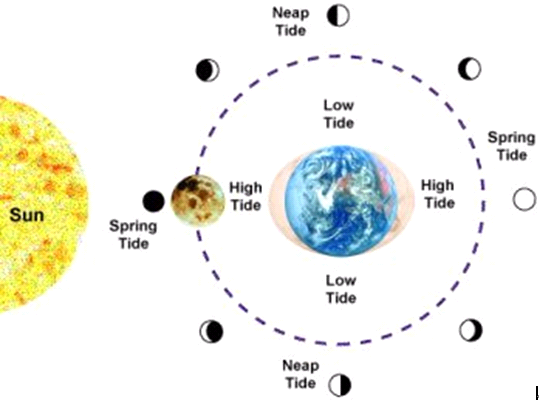
Tides based on the Sun, Moon and the Earth Positions:
The height of rising water (high tide) varies appreciably depending upon the position of sun and moon with respect to the earth. Spring tides and neap tides come under this category.
Spring tides: The position of both the sun and the moon in relation to the earth has direct bearing on tide height. When the sun, the moon and the earth are in a straight line, the height of the tide will be higher. These are called spring tides and they occur twice a month, one on full moon period and another during new moon period.
Neap tides: Normally, there is a seven day interval between the spring tides and neap tides. At this time the sun and moon are at right angles to each other and the forces of the sun and moon tend to counteract one another. The Moon’s attraction, though more than twice as strong as the sun’s, is diminished by the counteracting force of the sun’s gravitational pull. Once in a month, when the moon’s orbit is closest to the earth (perigee), unusually high and low tides occur. During this time the tidal range is greater than normal. Two weeks later, when the moon is farthest from earth (apogee), the moon’s gravitational force is limited and the tidal ranges are less than their average heights. When the earth is closest to the sun (perihelion), around 3rd January each year, tidal ranges are also much greater, with unusually high and unusually low tides. When the earth is farthest from the sun (aphelion), around 4th July each year, tidal ranges are much less than average. The time between the high tide and low tide, when the water level is falling, is called the ebb. The time between the low tide and high tide, when the tide is rising, is called the flow or food.
Ocean Currents
Ocean currents are like river flow in oceans. They represent a regular volume of water in a definite path and direction. Ocean currents are influenced by two types of forces namely: primary forces that initiate the movement of water; secondary forces that influence the currents to flow.
The primary forces that influence the currents are:
Heating by solar energy: Heating by solar energy causes the water to expand. That is why, near the equator the ocean water is about 8 cm higher in level than in the middle latitudes. This causes a very slight gradient and water tends to flow down the slope.
Wind: Wind blowing on the surface of the ocean pushes the water to move. Friction between the wind and the water surface affects the movement of the water body in its course.
Gravity: Gravity tends to pull the water down the pile and create gradient variation.
Coriolis force: The Coriolis force intervenes and causes the water to move to the right in the northern hemisphere and to the left in the southern hemisphere.
These large accumulations of water and the flow around them are called Gyres. These produce large circular currents in all the ocean basins. Differences in water density affect vertical mobility of ocean currents.
- Water with high salinity is denser than water with low salinity and in the same way cold water is denser than warm water. Denser water tends to sink, while relatively lighter water tends to rise.
- Cold-water ocean currents occur when the cold water at the poles sinks and slowly moves towards the equator. Warm-water currents travel out from the equator along the surface, flowing towards the poles to replace the sinking cold water.
Types of Ocean Currents
The ocean currents may be classified
Based on their depth as surface currents and deep water currents:
- Surface currents constitute about 10 per cent of all the water in the ocean; these waters are the upper 400 m of the ocean;
- Deep water currents make up the other 90 per cent of the ocean water. These waters move around the ocean basins due to variations in the density and gravity. Deep waters sink into the deep ocean basins at high latitudes, where the temperatures are cold enough to cause the density to increase.
Based on temperature: As cold currents and warm currents:
- Cold currents bring cold water into warm water areas. These currents are usually found on the west coast of the continents in the low and middle latitudes (true in both hemispheres) and on the east coast in the higher latitudes in the Northern Hemisphere;
- Warm currents bring warm: water into cold water areas and are usually observed on the east coast of continents in the low and middle latitudes (true in both hemispheres). In the northern hemisphere they are found on the west coasts of continents in high latitudes
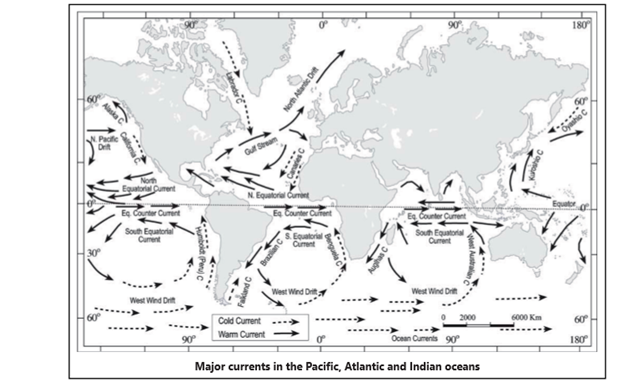
The Circulation of the Atlantic Ocean
- The steady Trade Winds constantly drift two streams of water from east to west. At the ‘shoulder’ of north-east Brazil, the protruding land mass splits the South Equatorial Current into the Cayenne Current which flows along the Guiana coast, and the Brazilian Current which flows southwards along the east coast of Brazil.
- In the North Atlantic Ocean, the Cayenne Current is joined and reinforced by the North Equatorial Current and heads north-westwards as a large mass of equatorial water into the Caribbean Sea. Part of the current enters the Gulf of Mexico and emerges from the Florida Strait between Florida and Cuba as the Florida Current. The rest of the equatorial water flows northwards east of the Antilles to join the Gulf Stream off the south-eastern U.S.A. The Gulf Stream Drift is one of the strongest ocean currents, 35 to 100 miles wide, 2,000 feet deep and with a velocity of three miles an hour. The current hugs the coast of America as far as Cape Hatteras (latitude 35°N.), where it is deflected eastwards under the combined influence of the Westerlies and the rotation of the earth. It reaches Europe as the North Atlantic Drift. This current, flowing at 10 miles per day, carries the warm equatorial water for over a thousand miles to the coasts of Europe. From the North Atlantic, it fans out in three directions, eastwards to Britain, northwards to the Arctic and southwards along the Iberian coast, as the cool Canaries Current. Oceanographic researches show that almost two- thirds of the water brought by the Gulf Stream to the Arctic regions is returned annually to the tropical latitudes by dense, cold polar water that creeps southwards in the ocean depths. The Canaries Current flowing southwards eventually merges with the North Equatorial Current, completing the clockwise circuit in the North Atlantic Ocean. Within this ring of currents, an area in the middle of the Atlantic has no perceptible current. A large amount of floating sea-weed gathers and the area is called the Sargasso Sea.
- Apart from the clockwise circulation of the currents, there are also currents that enter the North Atlantic from the Arctic regions. These cold waters are blown south by the out-flowing polar winds. The Irminger Current or East Greenland Current flows between Iceland and Greenland and cools the North Atlantic Drift at the point of convergence. The cold Labrador Current drifts south-eastwards between West Greenland and Baffin Island to meet the warm Gulf Stream off Newfoundland, as far south as 50°N. where the icebergs carried south by the Labrador Current melt.
- The South Atlantic Ocean follows the same pattern of circulation as the North Atlantic Ocean. The major differences are that the circuit is anti-clockwise and the collection of sea-weed in the still waters of the mid-South Atlantic is not so distinctive.
- Where the South Equatorial Current is split at Cape Sao Roque, one branch turns south as the warm Brazilian Current. Its deep blue waters are easily distinguishable from the yellow, muddy waters carried hundreds of miles out to sea by the Amazon further north. At about 40°S.
- The influence of the prevailing Westerlies and the rotation of the earth propel the current eastwards to merge with the cold West Wind Drift as the South Atlantic Current. On reaching the west coast of Africa the current is diverted northwards as the cold Benguela Current (the counterpart of the Canaries Current).
- It brings the cold polar waters of the West Wind Drift into tropical latitudes. Driven by the regular South-East Trade Winds, the Benguela Current surges equatorwards in a north-westerly direction to join the South Equatorial Current.
- This completes the circulation of the currents in the South Atlantic. Between the North and South Equatorial Currents is the east- flowing Equatorial Counter Current.
The Circulation of the Pacific Ocean
- The pattern of circulation in the Pacific is similar to that of the Atlantic except in modifications which can be expected from the greater size and the more open nature of the Pacific. The North Equatorial Current flows westwards with a compensating Equatorial Counter Current running in the opposite direction. Due to the greater expanse of the Pacific and the absence of an obstructing land mass the volume of water is very much greater than that of the Atlantic equatorial current. The North-East Trade Winds blow the North Equatorial Current off the coasts of the Philippines and Formosa into the East China Sea as the Kuroshio or Kuro Siwo or Japan Current.
- Its warm waters are carried polewards as the North Pacific Drift keeping the ports of the Alaskan coast ice-free in winter. The cold Bering Current or Alaskan Current creeps southwards from the narrow Bering Strait and is joined by the Okhotsk Current to meet the warm Japan Current as the Oyashio, off Hokkaido.
- The cold water eventually sinks beneath the warmer waters of the North Pacific Drift. Part of it drifts eastwards as the cool Californian Current along the coasts of the western U.S.A. and coalesces with the North Equatorial Current to complete the clockwise circulation.
- The current system of the South Pacific is the same as that of the South Atlantic. The South Equatorial Current, driven by the South-East Trade winds, flows southwards along the coast of Queensland as the East Australian Current, bringing warm equatorial waters into temperate waters. The current turns eastwards towards New Zealand under the full force of the Westerlies in the Tasman Sea and merges with part of the cold West Wind Drift as the South Pacific Current.
- Obstructed by the tip of southern Chile, the current turns northwards along the western coast of South America as the cold Humboldt or Peruvian Current.
- The cold water chills any wind that blows on-shore so that the Chilean and Peruvian coasts are practically rainless. The region is rich in microscopic marine plants and animals that attract huge shoals of fish.
- Consequently, millions of seabirds gather here to feed on the fish. Their droppings completely whiten the coastal cliffs and islands forming thick deposits of gucmo, a valuable source of fertilizer. The Peruvian Current eventually links up with the South Equatorial Current and completes the cycle of currents in the South Pacific.
The Indian Ocean Circulation
- The Equatorial Current, turning southwards past Madagascar as the Agulhas or Mozambique Current merges with the West Wind Drift, flowing eastwards and turns equator-wards as the West Australian Current.
- In the North Indian Ocean, there is a complete reversal of the direction of currents between summer and winter, due to the changes of monsoon winds. In summer from June to October, when the dominant wind is the South-West Monsoon, the currents are blown from a south-westerly direction as the South- West Monsoon Drift.
- This is reversed in winter, beginning from December, when the North-East Monsoon blows the currents from the north-east as the North-East Monsoon Drift.
- The currents of the North Indian Ocean, demonstrate most convincingly the dominant effects of winds on the circulation of ocean currents.
The Oceanic Deposits of the Ocean Floor
Materials eroded from the earth which are not deposited by rivers or at the coast are eventually dropped on the ocean floor. The dominant process is slow sedimentation where the eroded particles very slowly filter through the ocean water and settle upon one another in layers. The thickness of the layer of sediments is still unknown. Its rate of accumulation is equally uncertain. Generally speaking, we may classify all the oceanic deposits as either muds, oozes or clays.
- The muds-These are terrigenous deposits because they are derived from land and are mainly deposited on the continental shelves. The muds are referred to as blue, green or red muds; their colouring depends upon their chemical content.
- The oozes-These are pelagic deposits because they are derived from the oceans. They are made of the shelly and skeletal remains of marine micro¬organisms with calcareous or siliceous parts. Oozes have a very fine; flour-like texture and either occur as accumulated deposits or float about in suspension.
- The clays-These occur mainly as red clays in the deeper parts of the ocean basins, and arc particularly abundant in the Pacific Ocean. Red clay is believed to be an accumulation of VOLCANIC DUST blown out from volcanoes during volcanic eruptions.
Coastal Regulation Zone
Context
Supreme Court has ordered the demolition of Maradu Apartments in Kerala for violation Coastal Regulation Zone (CRZ) norms.
About
- Under the Environment Protection Act, 1986 Ministry of Environment and Forests (MoEF) issued notification in 1991, for regulation of activities in the coastal area.
- Coastal Regulation Zone (CRZ) is the area up to 500m from the high-tide line and a stage of 100m along banks of creeks, estuaries, backwater and rivers subject to tidal fluctuations.
- CRZ Rules govern human and industrial activity close to the coastline, in order to protect the fragile ecosystems near the sea.
- The Union Ministry of Environment, Forest and Climate Change has notified the 2019 Coastal Regulation Zone (CRZ) norms, replacing the existing CRZ norms of 2011.
- The new CRZ norms aim to promote sustainable development based on scientific principles.
- Coastal Regulation Zones (CRZ) 1991 notification gave four fold classifications of coastal areas.
- CRZ-1: These are ecologically sensitive areas as they help in maintaining the ecosystem of the coast. They lie between low and high tide line. Exploration of natural gas and extraction of salt are permitted
- CRZ-2: These areas are urban areas located in the coastal areas. Now under new coastal zone regulations 2018, the floor space index norms have been de-freezed.
- CRZ-3: rural and urban localities which fall outside the 1 and 2. Only certain activities related to agriculture even some public facilities are allowed in this zone
- CRZ-4: this lies in the aquatic area up to territorial limits. Fishing and allied activities are permitted in this zone. Solid waste should be let off in this zone. This zone has been changed from 1991 notification, which covered coastal stretches in islands of Andaman & Nicobar and Lakshdweep
Changes Brought about by CRZ Regulations 2019
States found the 1991 Rules to be extremely restrictive. They complained that if applied strictly, the Rules would not allow simple things like building decent homes for people living close to the coast, and carrying out basic developmental works 2019 CRZ notification brought following changes:
- Two separate categories for CRZ-III (Rural) areas:
- CRZ-III A: The A category of CRZ-III areas are densely populated rural areas with a population density of 2161 per square kilometre as per 2011 Census. Such areas have a No Development Zone (NDZ) of 50 meters from the High Tide Line (HTL) as against 200 meters from the High Tide Line stipulated in the CRZ Notification, 2011.
- CRZ-III B – The B category of CRZ-III rural areas have population density of below 2161 per square kilometre as per 2011 Census. Such areas have a No Development Zone of 200 meters from the HTL.
- No-development zone of 20 m for all islands close to the mainland coast, and for all backwater islands in the mainland.
- The government has decided to de-freeze the Floor Space Index and permit FSI for construction projects to do away with CRZ 2011 notification
- Tourism infrastructure like shacks, toilet blocks, change rooms, drinking water facilities, etc. permitted in coastal areas: The new norms permit temporary tourism facilities such in Beaches.
- To address pollution in Coastal areas, the treatment facilities have been made permissible in CRZ-I B area subject to necessary safeguards.
Criticism
- CRZ notification has been amended 34 times in 27 years, not to protect the coast but to open it up for development.
- Though exemption was made for the construction of the Navi Mumbai airport but the POSCO project had failed to take off due to other reasons. Projects of the Department of Atomic Energy, which plans to set up nuclear power plants near the coast, were also exempted which have serious environmental implication as we leant from the Fakushima nuclear disaster 2011.
- Large scale construction in CRZ has huge implications on Environment.
Conclusion
A balanced approach to achieve developmental goals without hurting the environment should be the policy push.
Mass extinctions
Context
In the last 500 million years, 75 to more than 90 percent of all species on Earth have disappeared in mass extinctions.
About
What is mass extinction?
Mass extinctions are defined as any substantial increase in the amount of extinction (lineage termination) suffered by more than one geographically wide-spread higher taxon during a relatively short interval of geologic time, resulting in an at least temporary decline in their standing diversity.
Major mass extinction events in the geological history of Earth:
Ordovician-Silurian extinction 485 to 444 million years ago:
- During this period massive glaciation locked up huge amounts of water in an ice cap that covered parts of a large south polar landmass. This may have been triggered by the rise of North America’s Appalachian Mountains.
- The large-scale weathering of these freshly uplifted rocks sucked carbon dioxide out of the atmosphere and drastically cooled the planet.
- As a result, sea levels plummeted by hundreds of feet. Creatures living in shallow waters would have seen their habitats cool and shrink dramatically, dealing a major blow.
Late Devonian extinction - 383-359 million years ago:
- Starting 383 million years ago, this extinction event eliminated about 75 percent of all species on Earth over a span of roughly 20 million years.
- Volcanism could be a possible trigger for this extinction.
- Within a couple million years of the Kellwasser event, a large igneous province called the Viluy Traps erupted 240,000 cubic miles of lava in what is now Siberia. The eruption would have spewed greenhouse gases and sulfur dioxide, which can cause acid rain.
- Asteroids may also have contributed. Sweden’s 32-mile-wide Siljan crater, one of Earth’s biggest surviving impact craters, formed about 377 million years ago.
- During the Devonian, plants hit on several winning adaptations, including the stem-strengthening compound lignin and a full-fledged vascular structure. These traits allowed plants to get bigger and for their roots to get deeper than ever before, which would have increased the rate of rock weathering.
- The faster rocks weathered, the more excess nutrients flowed from land into the oceans. The influx would have triggered algae growth, and when these algae died, their decay removed oxygen from the oceans to form what are known as dead zones. In addition, the spread of trees would have sucked CO2 out of the atmosphere, potentially ushering in global cooling.
Permian-Triassic extinction - 252 million years ago:
- Of the five mass extinctions, the Permian-Triassic is the only one that wiped out large numbers of insect species. Marine ecosystems took four to eight million years to recover.
- The extinction’s single biggest cause is the Siberian Traps, an immense volcanic complex that erupted more than 720,000 cubic miles of lava across what is now Siberia. The eruption triggered the release of at least 14.5 trillion tons of carbon.
- Magma from the Siberian Traps infiltrated coal basins on its way toward the surface, probably releasing even more greenhouse gases such as methane.
- In the million years after the event, seawater and soil temperatures rose between 25 to 34 degrees Fahrenheit.
- As temperatures rose, rocks on land weathered more rapidly, hastened by acid rain that formed from volcanic sulfur. Just as in the late Devonian, increased weathering would have brought on anoxia that suffocated the oceans. Climate models suggest that at the time, the oceans lost an estimated 76 percent of their oxygen inventory. These models also suggest that the warming and oxygen loss account for most of the extinction’s species losses.
Triassic-Jurassic extinction - 201 million years ago:
- This mass extinction caused the extinction of 80 percent of all land and marine species.
- At the end of the Triassic, Earth warmed an average of between 5 and 11 degrees Fahrenheit, driven by a quadrupling of atmospheric CO2 levels. This was probably triggered by huge amounts of greenhouse gases from the Central Atlantic Magmatic Province, a large igneous province in central Pangaea.
- Remnants of those ancient lava flows are now split across eastern South America, eastern North America, and West Africa.
- The Central Atlantic Magmatic Province was enormous. Its lava volume could cover the continental U.S. in a quarter-mile of rock.
- The uptick in CO2 acidified the Triassic oceans, making it more difficult for marine creatures to build their shells from calcium carbonate.
- On land, the dominant vertebrates had been the crocodilians, which were bigger and far more diverse than they are today. Many of them died out. In their wake, the earliest dinosaurs—small, nimble creatures on the ecological periphery—rapidly diversified.
Cretaceous-Paleogene extinction - 66 million years ago:
- The Cretaceous-Paleogene extinction event is the most recent mass extinction and the only one definitively connected to a major asteroid impact.
- Some 76 percent of all species on the planet, including all nonavian dinosaurs, went extinct.
- About 66 million years ago, an asteroid roughly 7.5 miles across slammed into the waters off of Mexico’s Yucatán Peninsula at 45,000 miles an hour. The massive impact left a crater more than 120 miles wide flung huge volumes of dust, debris, and sulfur into the atmosphere, bringing on severe global cooling.
- Wildfires ignited any land within 900 miles of the impact, and a huge tsunami rippled outward from the impact. Overnight, the ecosystems that supported nonavian dinosaurs began to collapse.
- Global warming fueled by volcanic eruptions at the Deccan Flats in India may have aggravated the event. Some scientists even argue that some of the Deccan Flats eruptions could have been triggered by the impact.
Extinction today
- Earth is currently experiencing a biodiversity crisis. Recent estimates suggest that extinction threatens up to a million species of plants and animals, in large part because of human activities such as deforestation, hunting, and overfishing.
- Other serious threats include the spread of invasive species and diseases from human trade, as well as pollution and human-caused climate change.
- Today, extinctions are occurring hundreds of times faster than they would naturally. If all species currently designated as critically endangered, endangered, or vulnerable go extinct in the next century, and if that rate of extinction continues without slowing down, we could approach the level of a mass extinction in as soon as 240 to 540 years.
Hurricane Dorian
Context
- Hurricane Dorian is a strong tropical cyclone currently affecting the Bahamas and the South-eastern United States. At least 5 people have dies and 21 injured.
- It is one of the most powerful storms ever to hit Atlantic. Despite getting downgraded to Category 2, it is expected to remain very powerful for the next few days.
About
- Hurricane - A hurricane is a large rotating storm with high speeds of wind that gust at least 74 mph that forms over warm waters in tropical areas.
- Hurricanes have three main parts, the calm eye in the center, the eyewall where the winds and rains are the strongest, and the rain bands which spin out from the center and give the storm its size.
- In the southern hemisphere, hurricanes rotate in a clockwise direction, and in the northern hemisphere they rotate in an anti-clockwise direction. This is due to what’s called the Coriolis force, produced by the Earth’s rotation.
How are hurricanes formed?
- Hurricanes begin as tropical disturbances in warm ocean waters with surface temperatures of at least 80 degrees Fahrenheit (26.5 degrees Celsius). Those low-pressure systems are fed by energy from warm seas.
- A storm with wind speeds of 38 miles (61 km) an hour or less is classified as a tropical depression. It becomes a tropical storm—and is given a name, according to conventions determined by the World Meteorological Organization—when its sustained wind speeds top 39 miles (63 km) an hour.
- Hurricanes are enormous heat engines that deliver energy on a staggering scale. They draw heat from warm, moist ocean air and release it through condensation of water vapor in thunderstorms.
- Hurricanes spin around a low-pressure center known as the eye. Sinking air makes this 20- to 40-mile-wide (32- to 64-kilometer-wide) area notoriously calm. But the eye is surrounded by a circular “eye wall” that contains the storm’s strongest winds and rain.
Measurement
- The size of Hurricane is mainly measured by the Saffir-Simpson scale – other scales are used in Asia Pacific and Australia.
The system divides storms into five categories:
- Category 1: Winds 74 to 95 mph (Minor damage)
- Category 2: Winds 96 to 110 mph (Extensive damage — Can uproot trees and break windows)
- Category 3: Winds 111 to 129 mph (Devastating — Can break windows and doors)
- Category 4: Winds 130 to 156 mph (Catastrophic damage — Can tear off roofs)
- Category 5: Winds 157 mph or higher (The absolute worst and can level houses and destroy buildings)
Naming
- Hurricanes are given names by the World Meteorological Organisation (WMO) so that they can be distinguished.
- Each year, tropical storms are named in alphabetical order according to a list produced by the WMO.
- That name stays with the storm if it develops into a hurricane.
- The names can only be repeated after six years.
Hurricane Dorian
- Dorian is estimated to be the second-most-powerful hurricane ever recorded in the Atlantic Ocean and ties the record for the most-powerful storm to make landfall, according to the National Weather Service
- The storm is not currently expected to make landfall in the US; it should instead stay uncomfortably close offshore.
- The storm could bring several inches of rain or more for parts of Florida and the Southeast.
- The deadliest aspect of a hurricane tends to be storm surge (flooding caused by seawater pushed onshore by the hurricane’s winds).
- Reason behind downgrading of Category of Dorian: Dorian has slowed down because a high pressure ridge that was steering the storm westward has weakened. Now, the storm is essentially waiting for another external force before it starts moving quickly again.
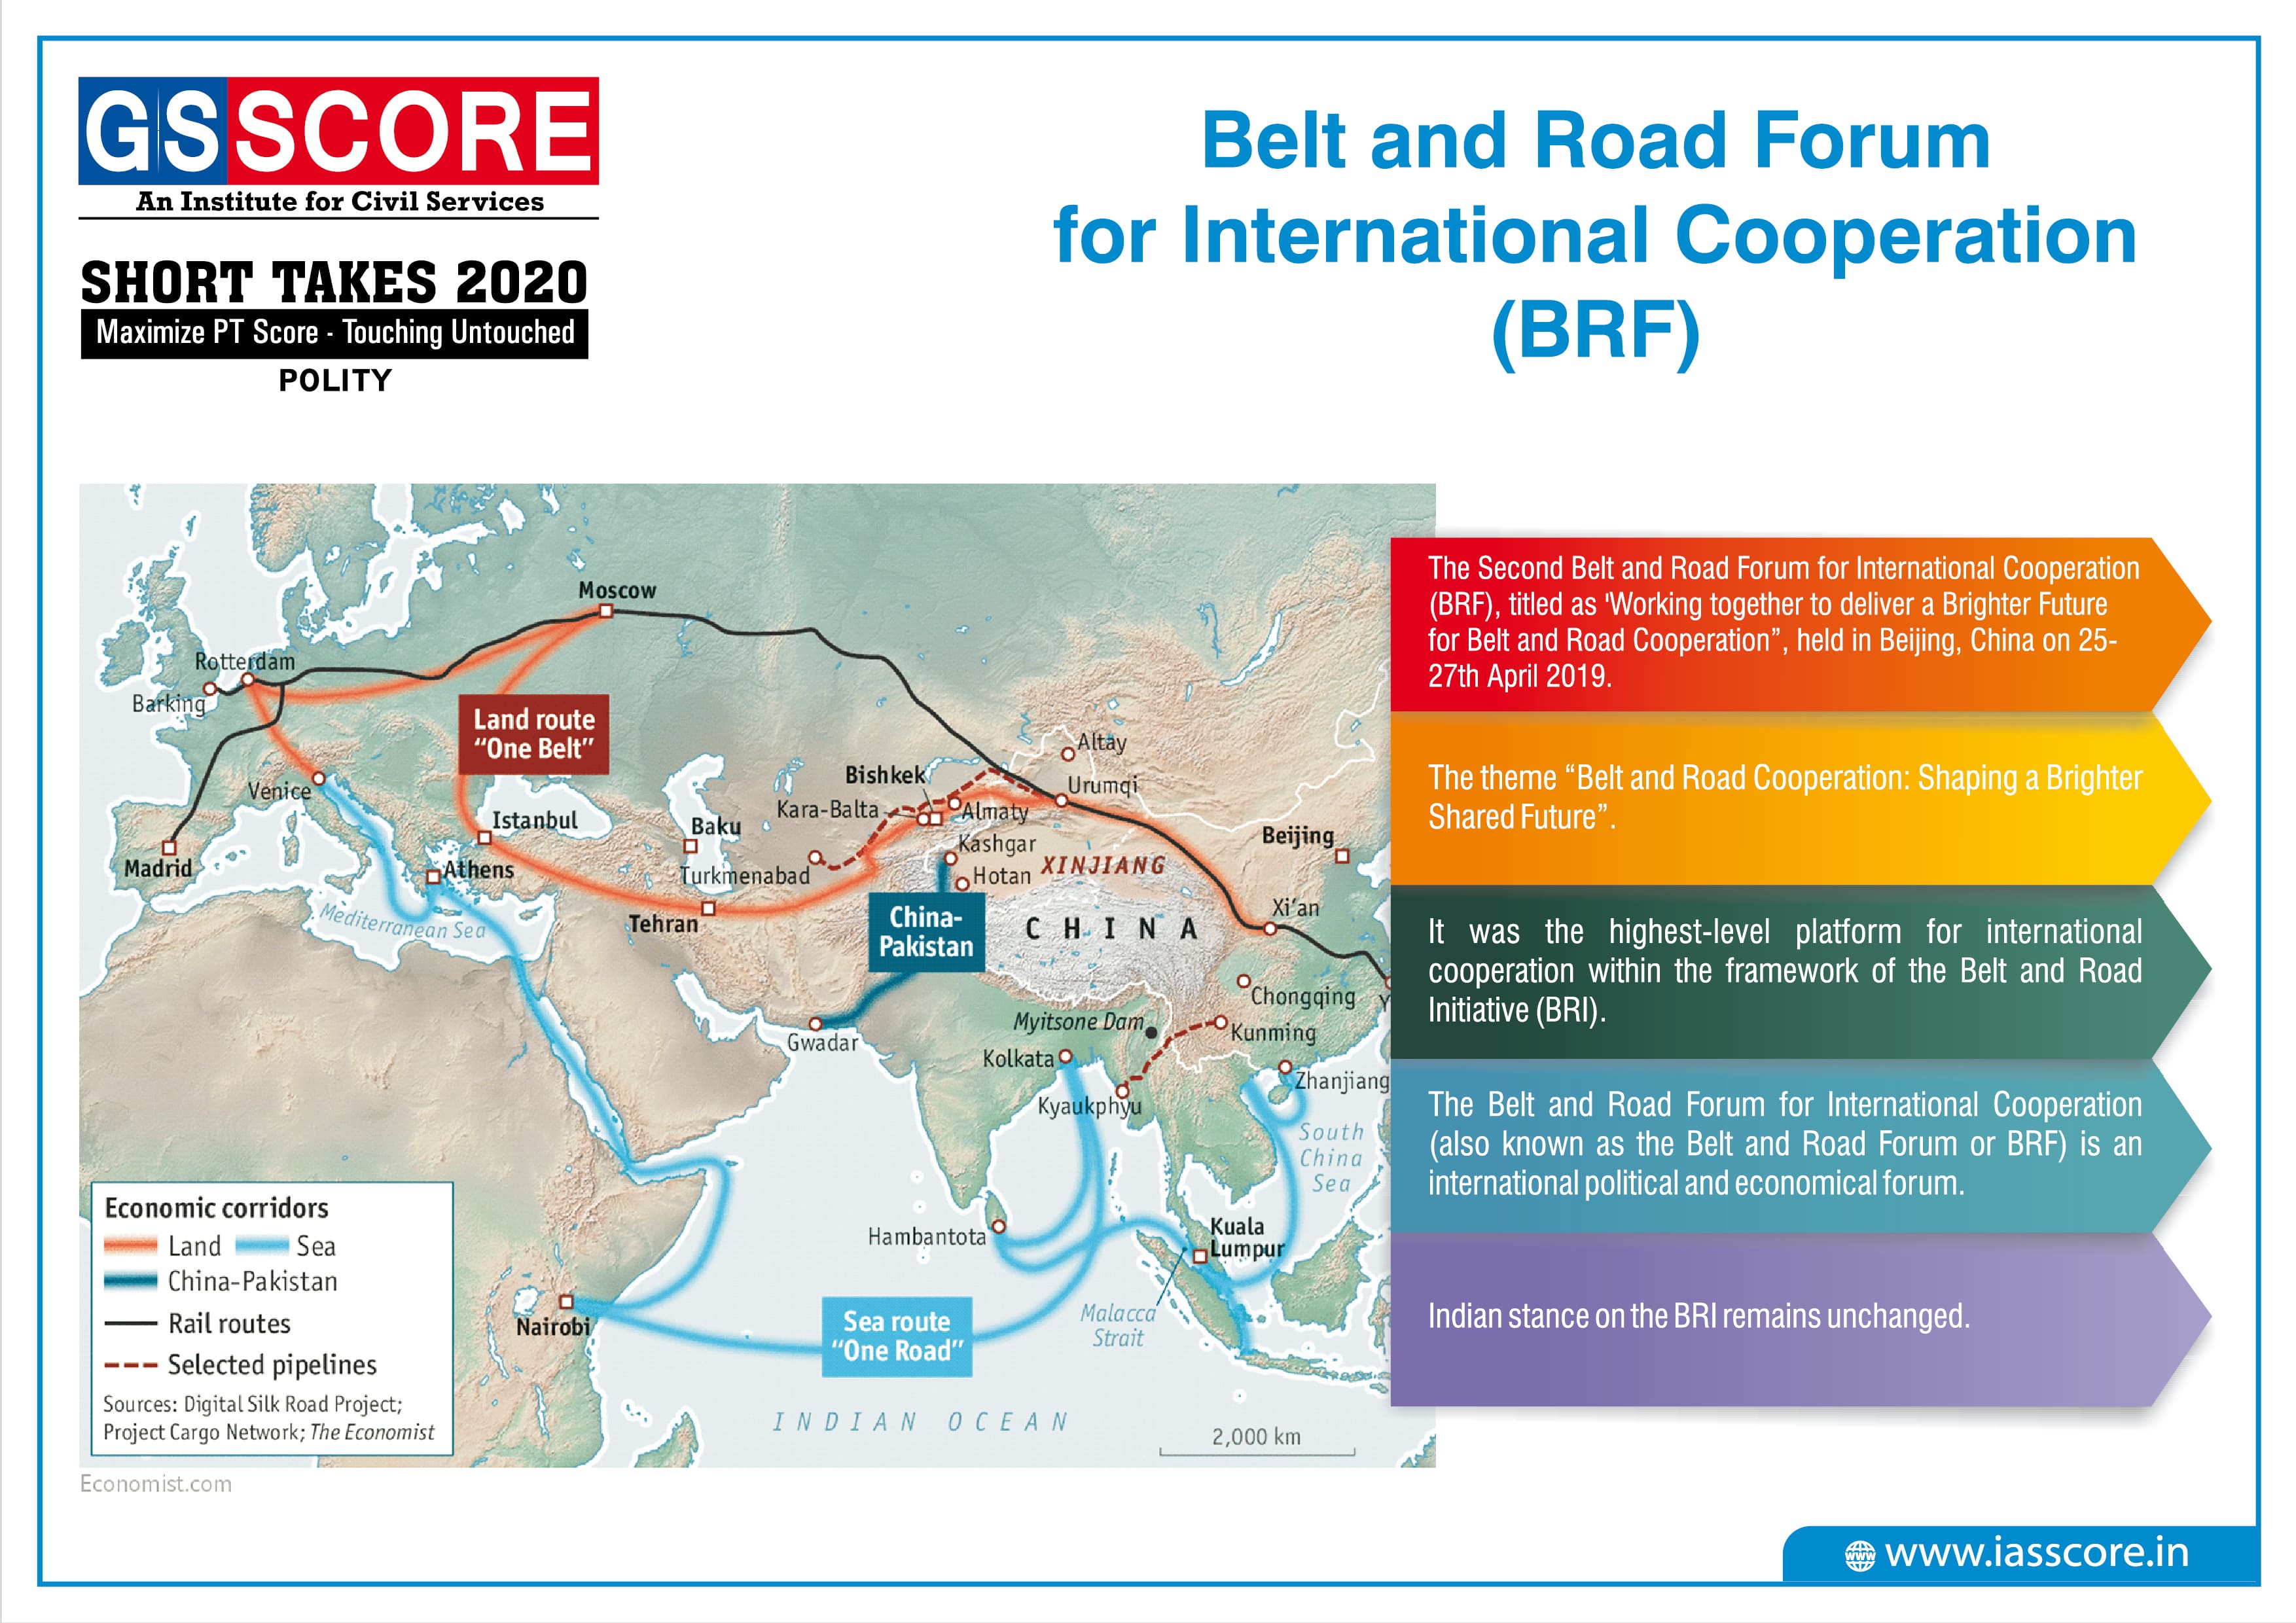
Belt and Road Forum for International Cooperation (BRF)
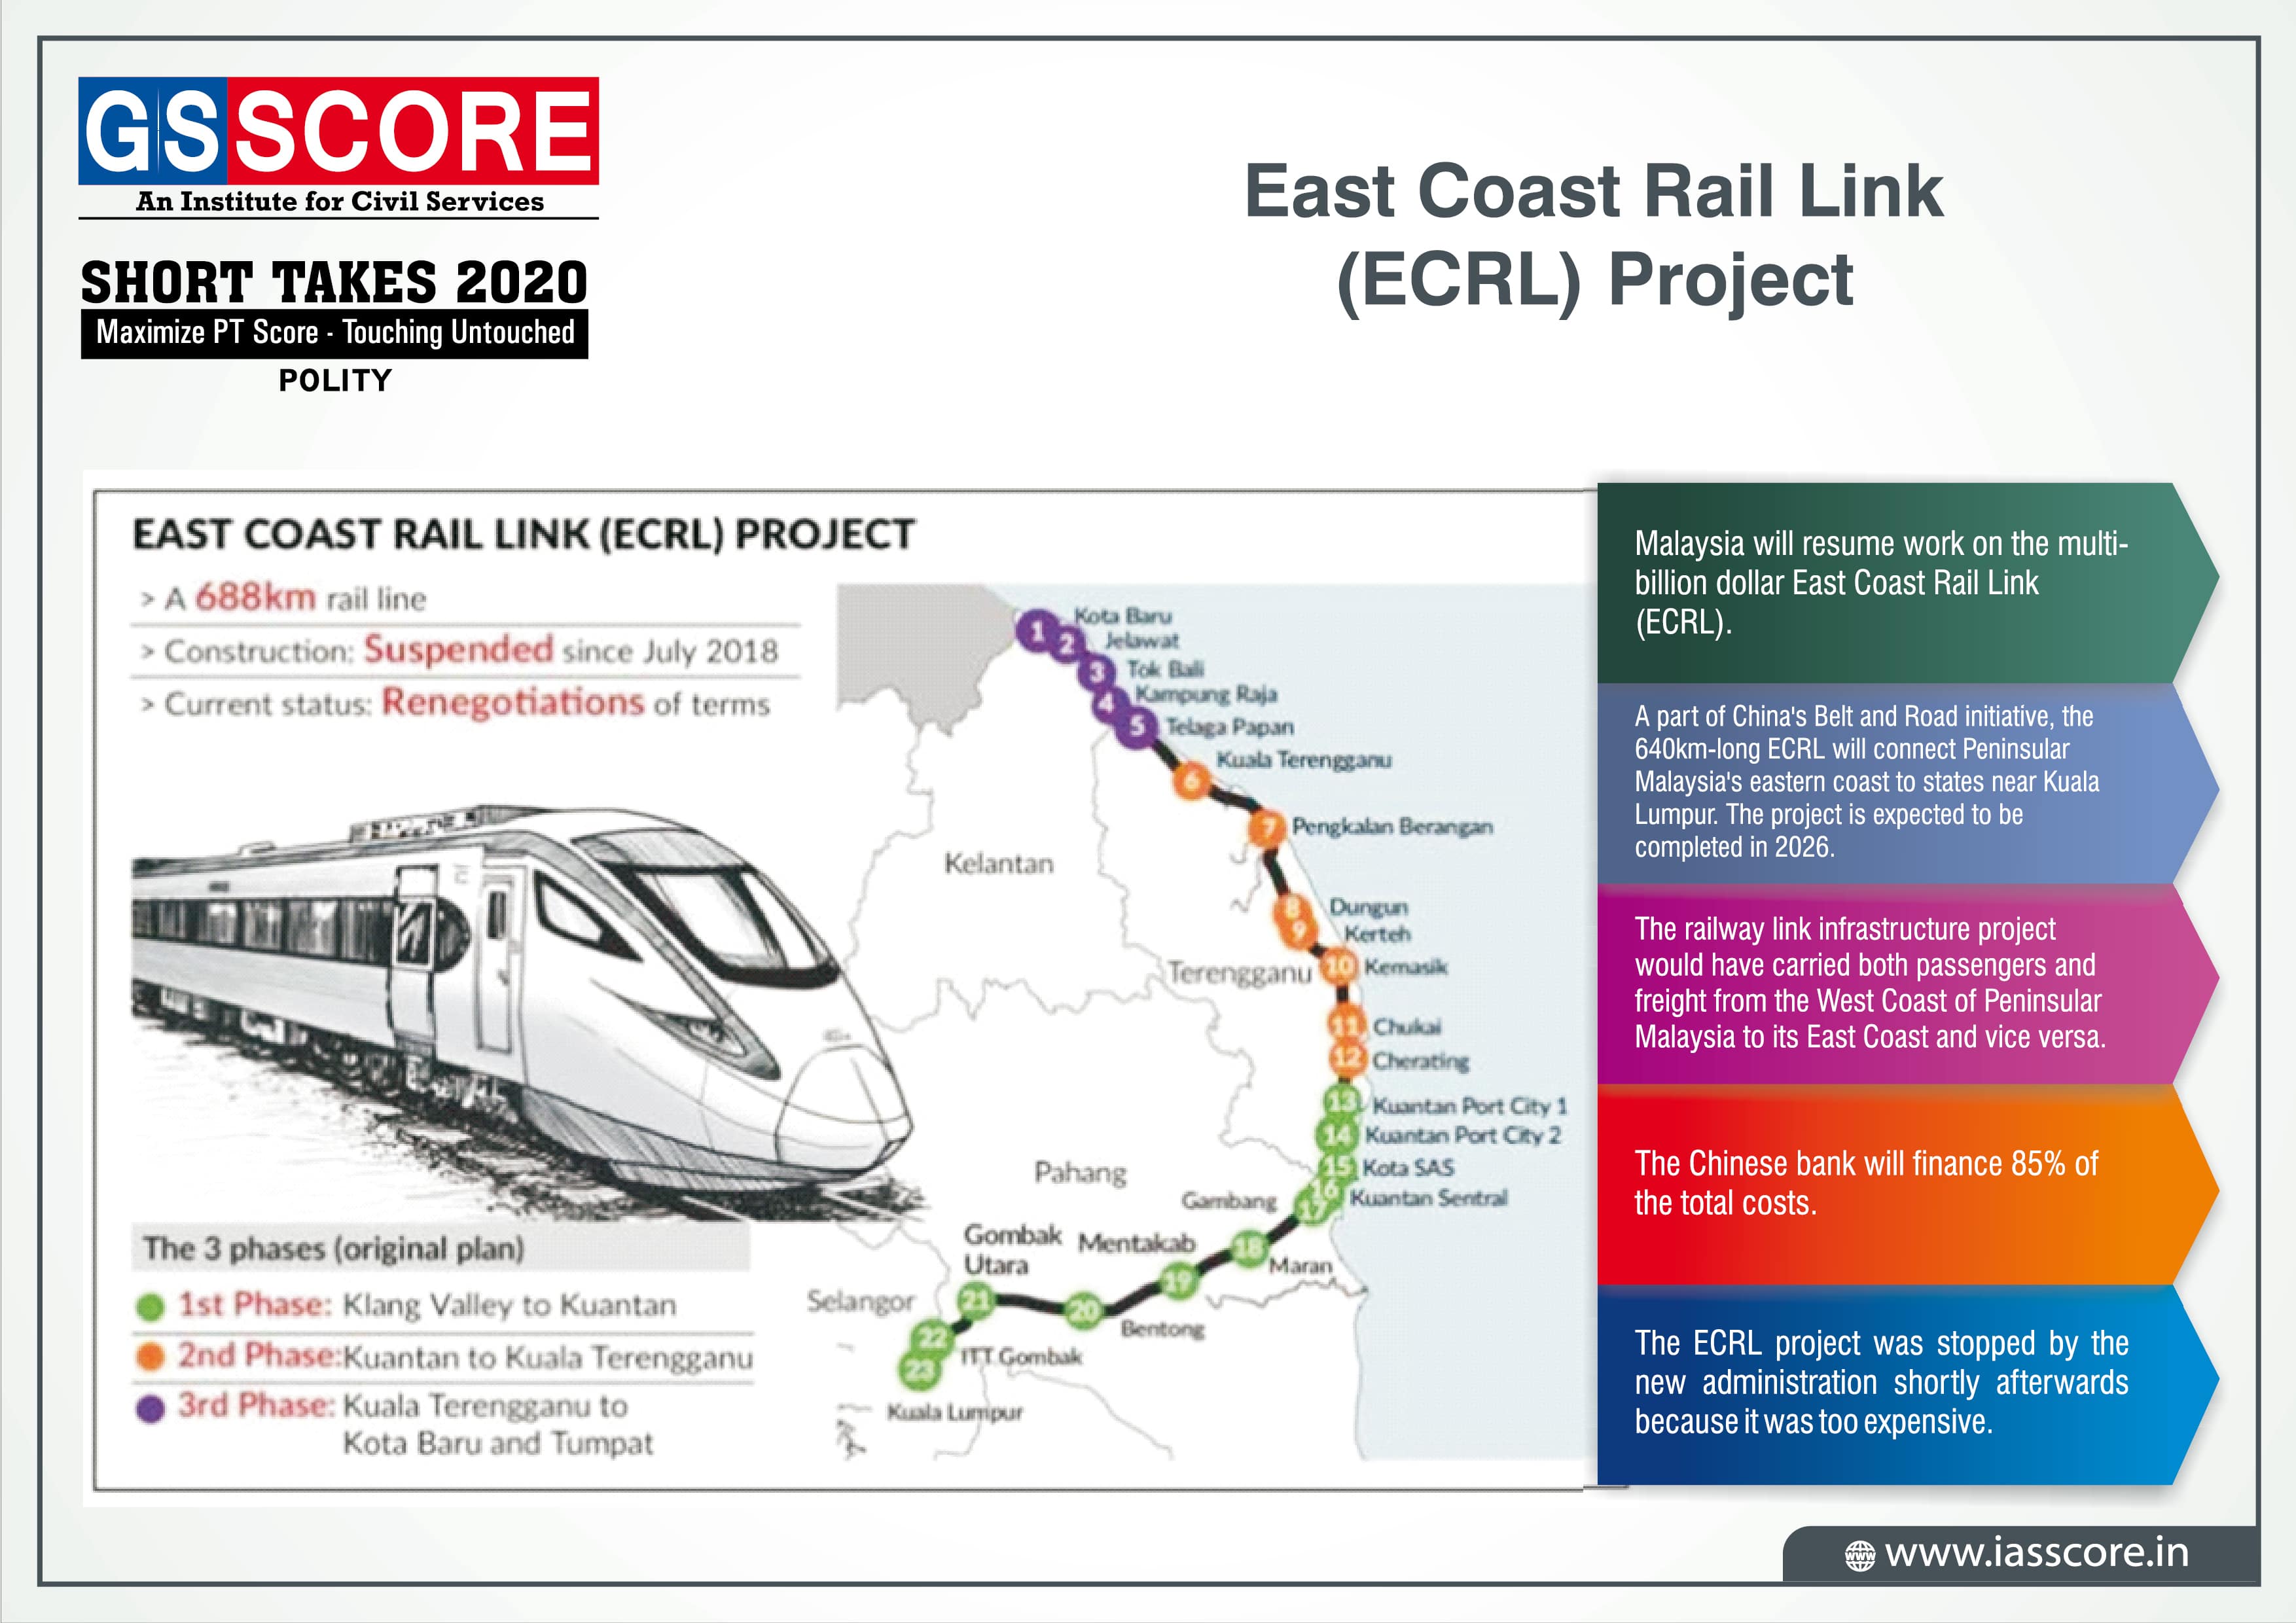
East Coast Rail Link (ECRL) Project
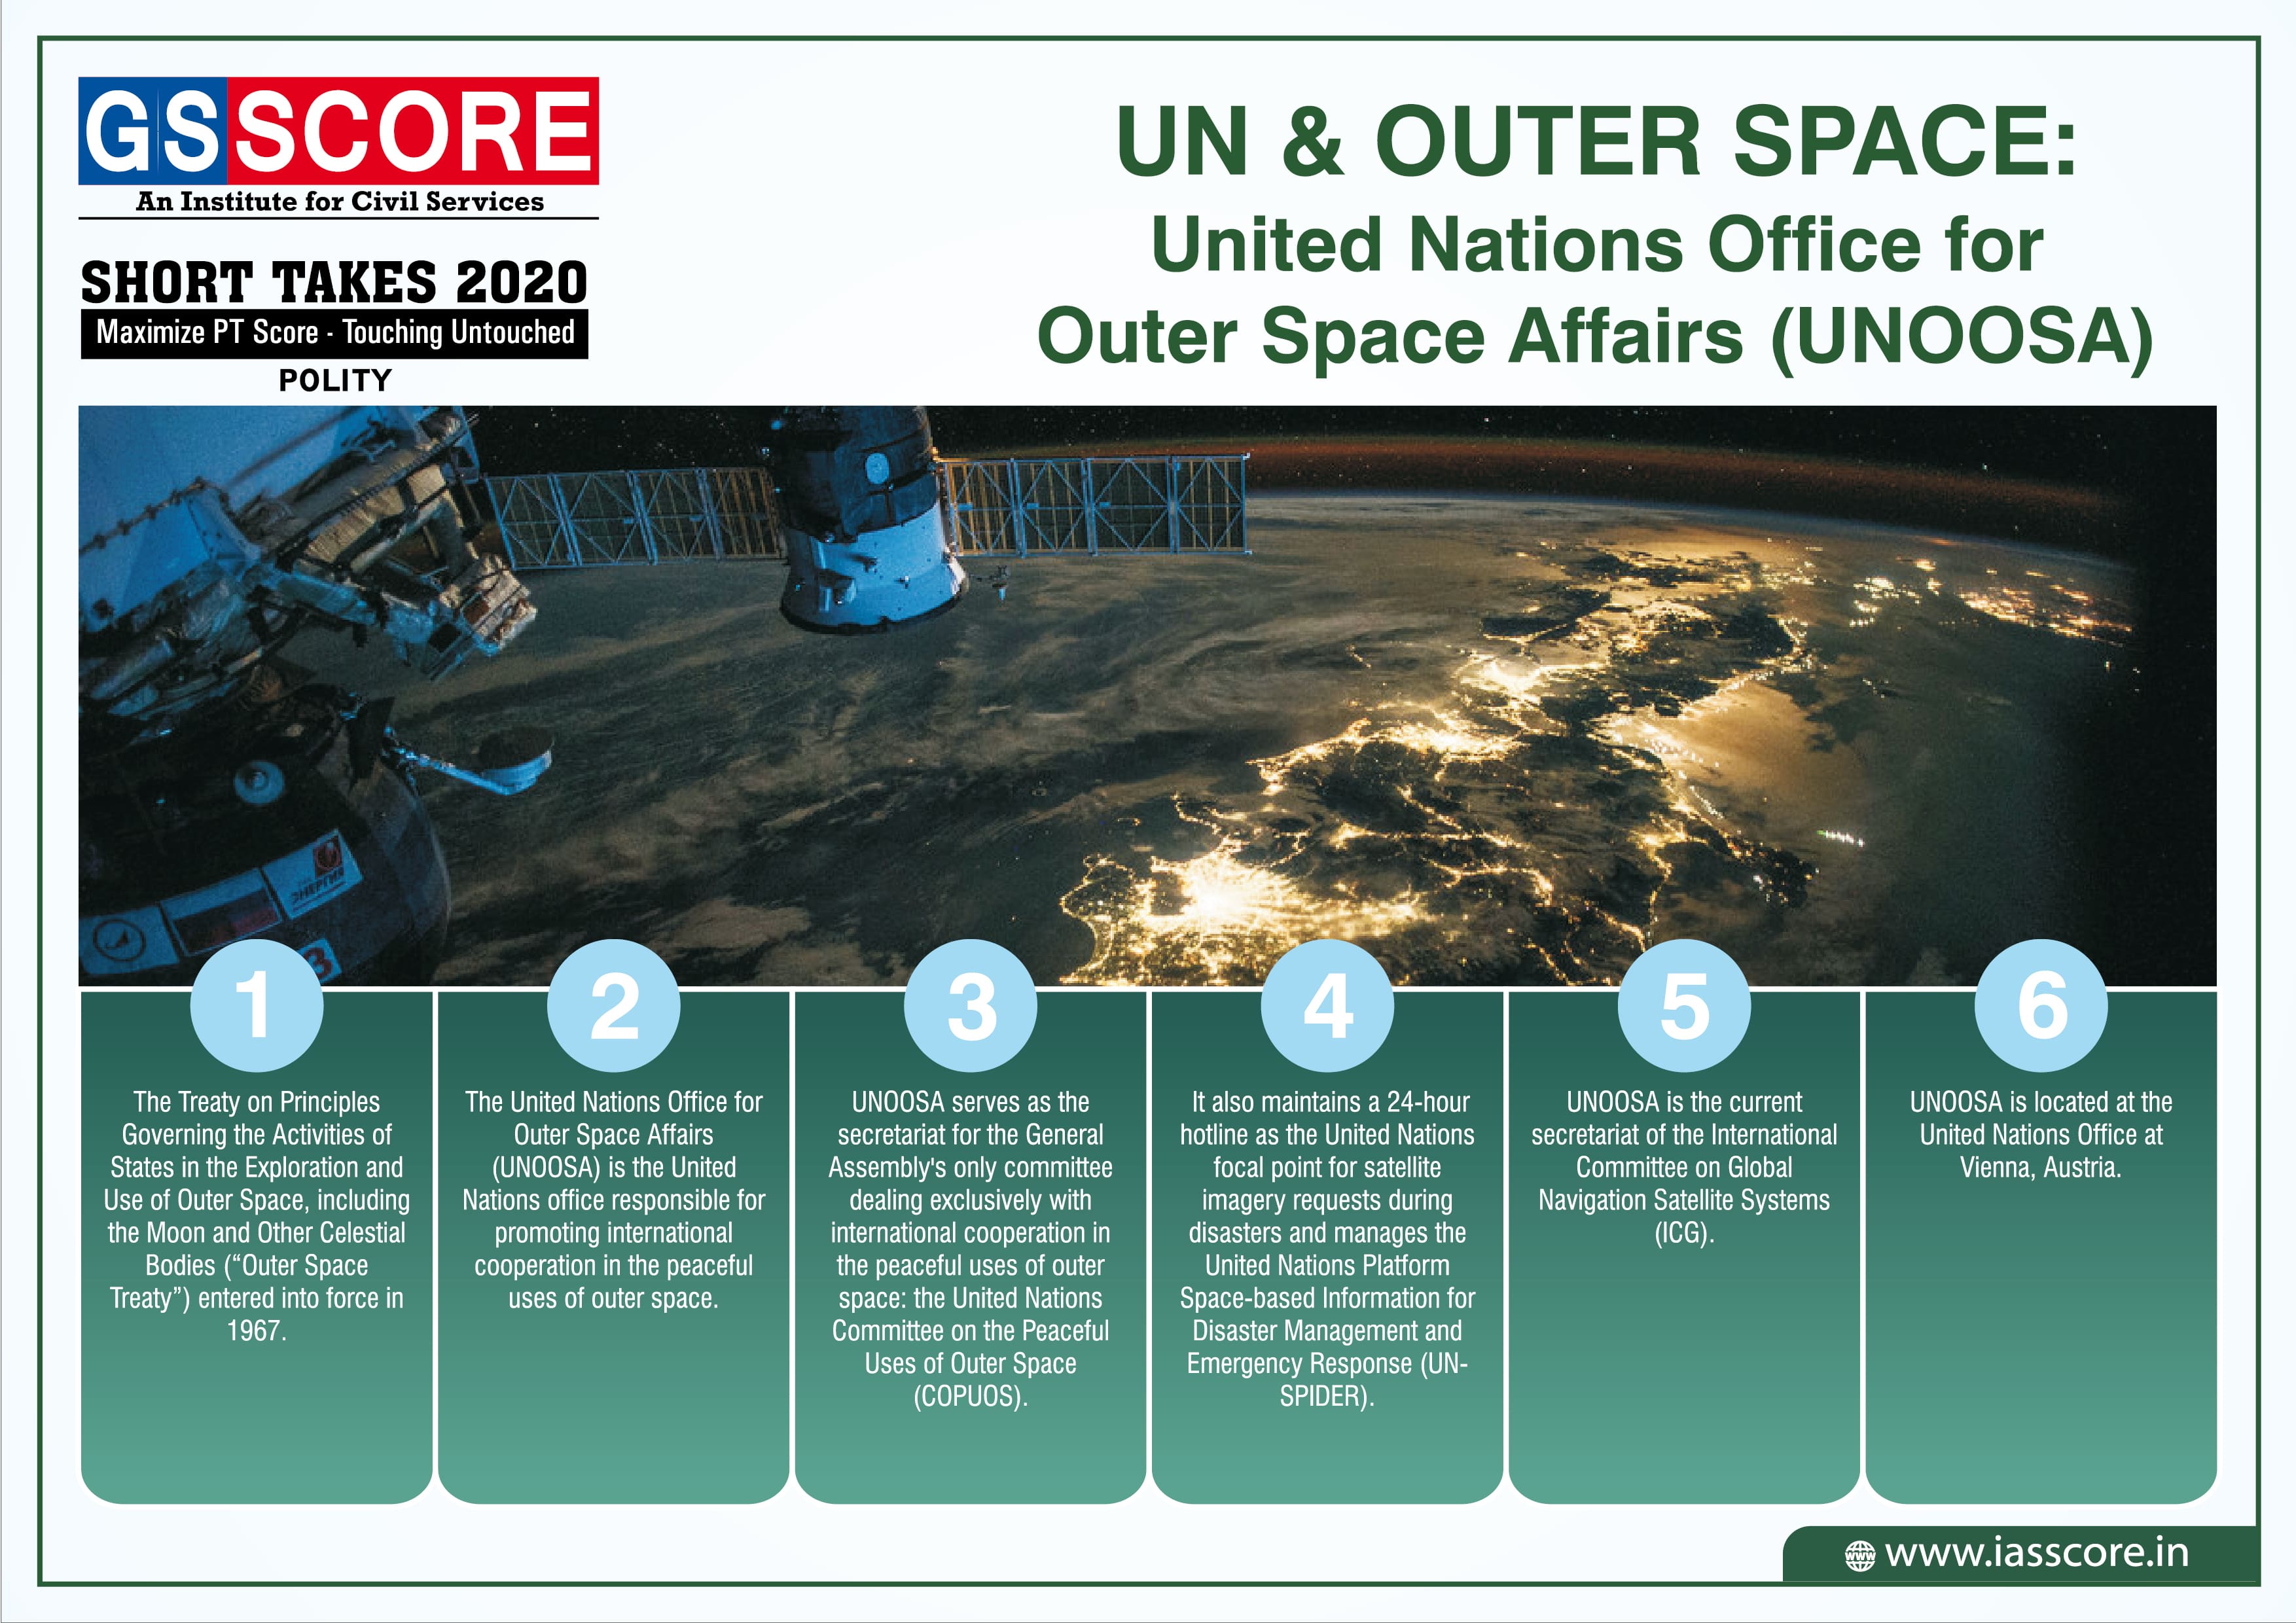
UN AND OUTER SPACE: United Nations Office for Outer Space Affairs (UNOOSA)
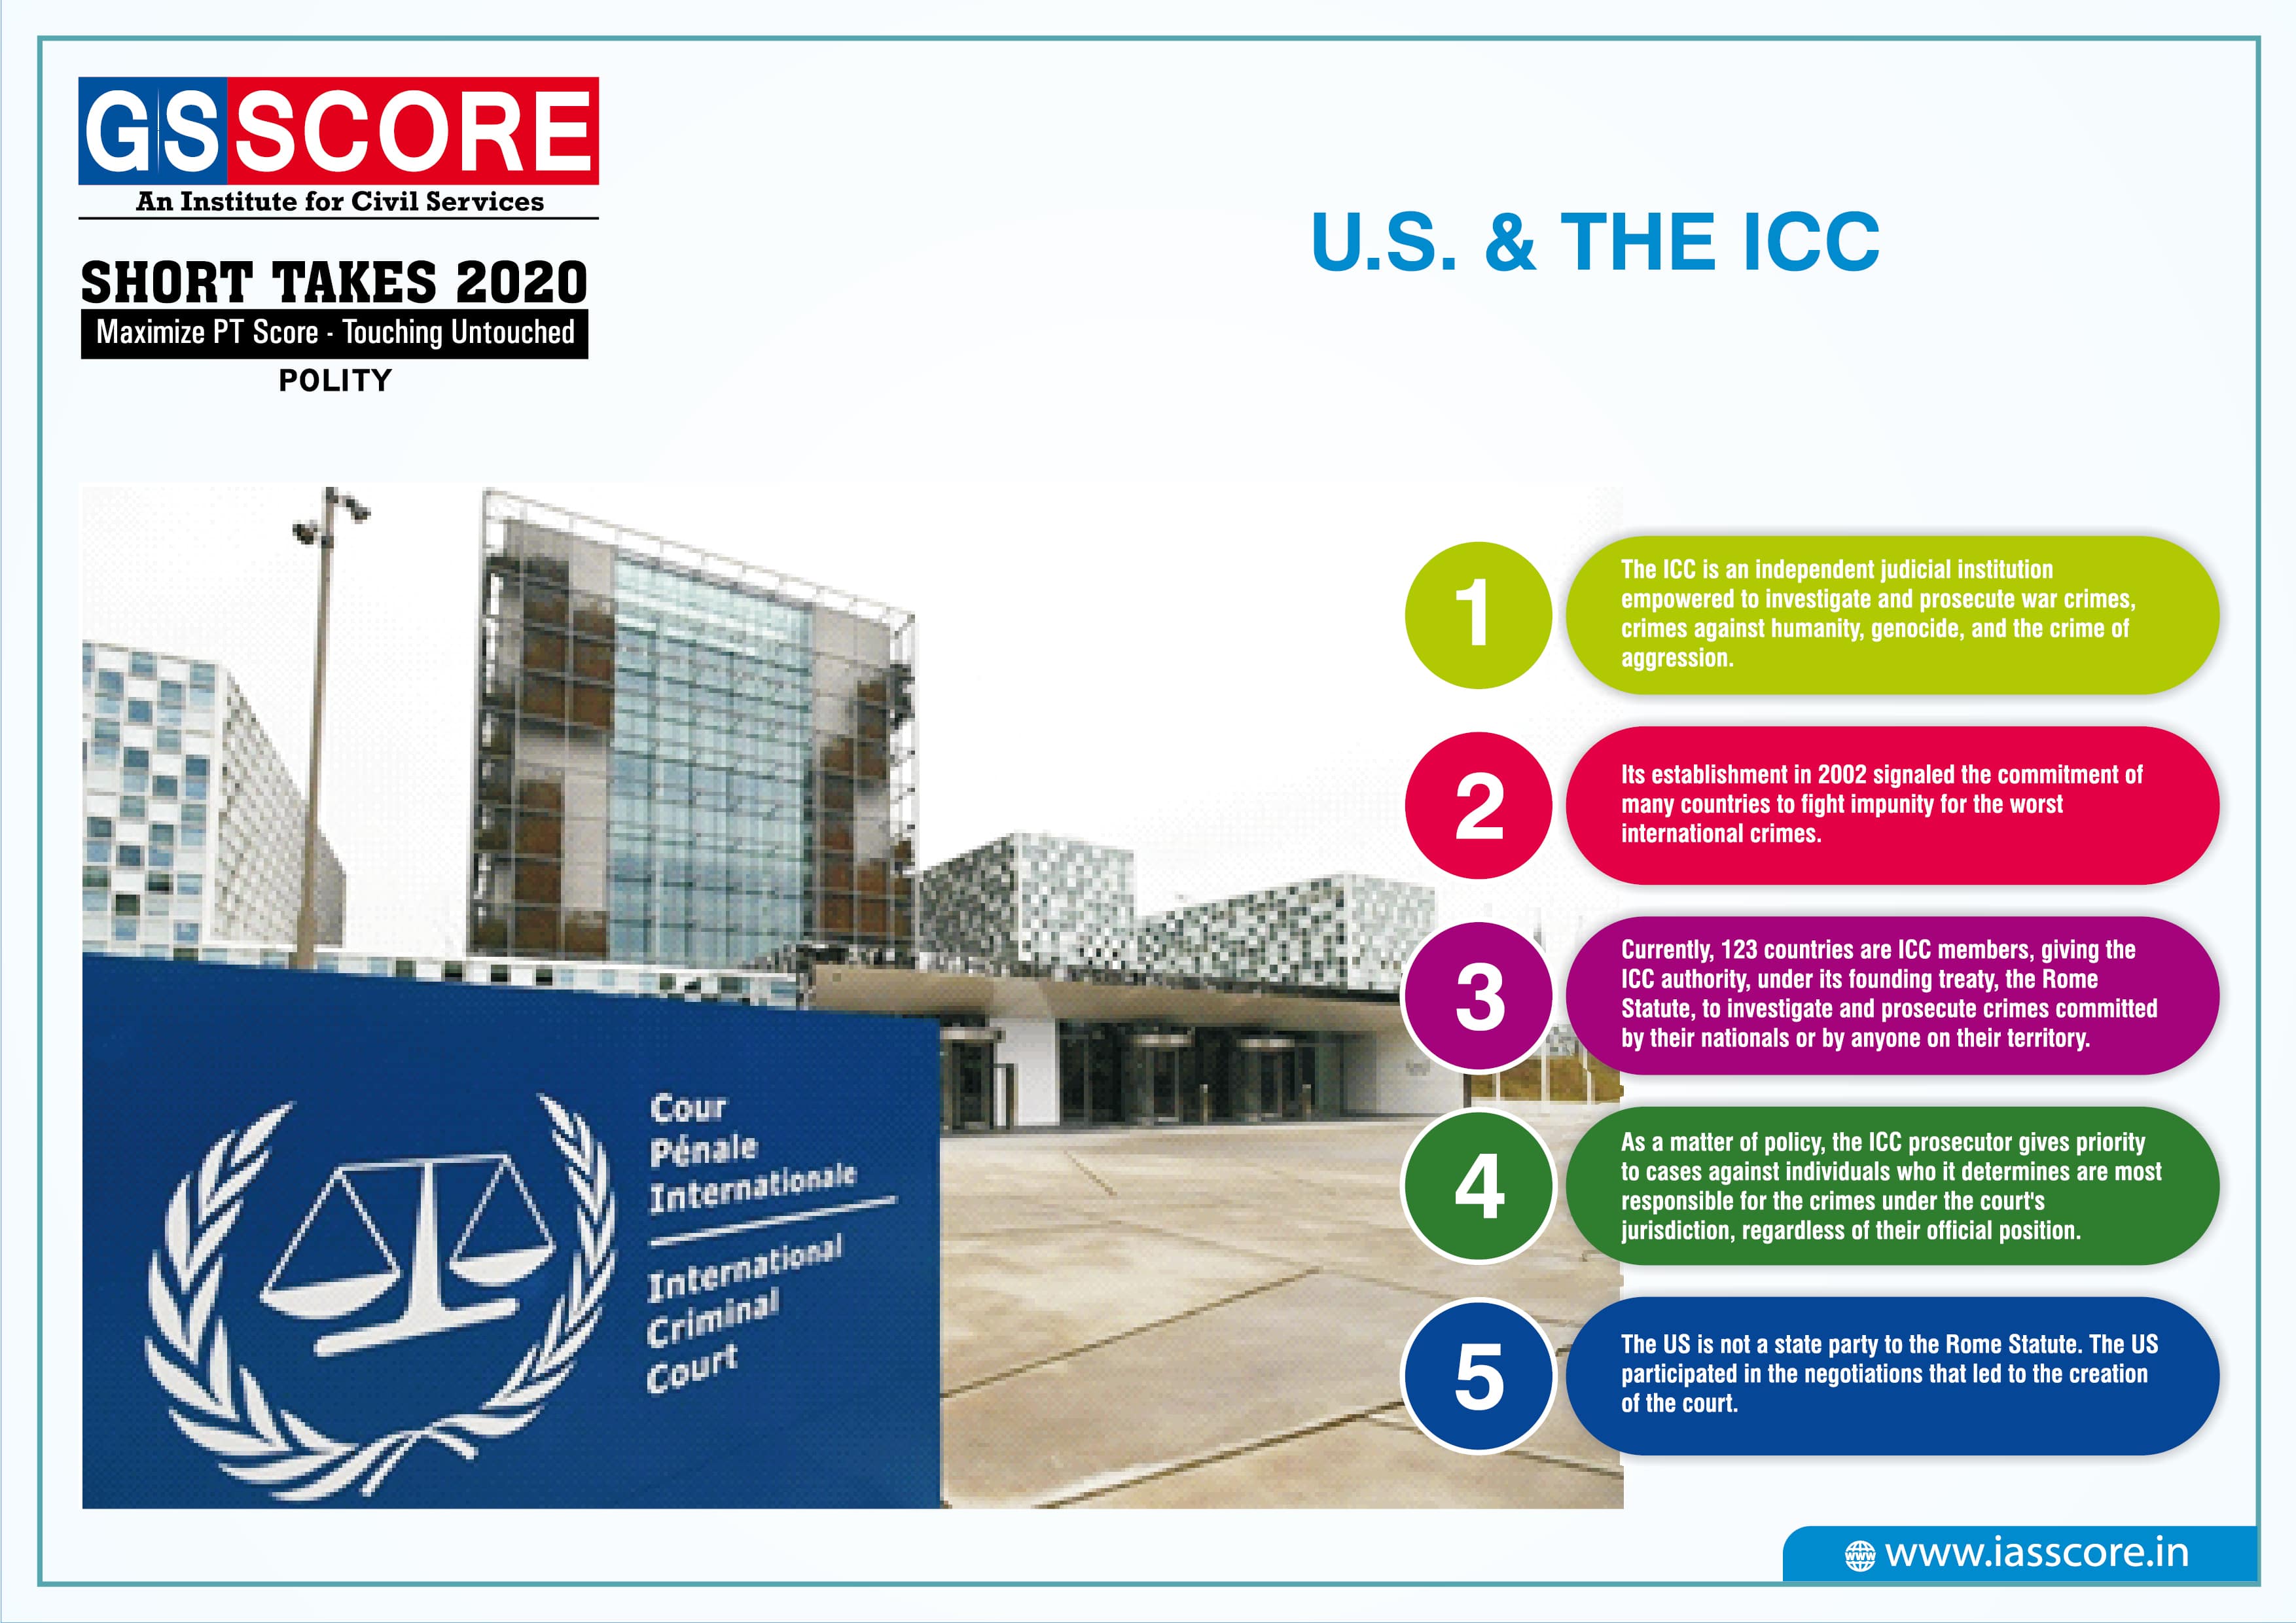
U.S. & THE ICC
Zayed Medal & Order Of ST. Andrew