

14th July 2025 (11 Topics)
1
Jul
2
Jul
3
Jul
4
Jul
5
Jul
7
Jul
8
Jul
9
Jul
10
Jul
11
Jul
12
Jul
14
Jul
15
Jul
16
Jul
17
Jul
18
Jul
19
Jul
21
Jul
22
Jul
23
Jul
24
Jul
25
Jul
26
Jul
28
Jul
29
Jul
30
Jul
31
Jul
Inequality in India
Context:
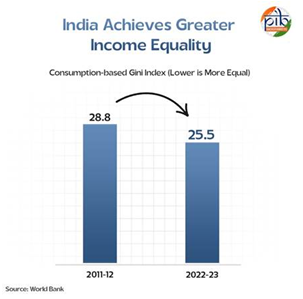
A World Bank report (2025) claims that inequality in India has reduced, especially in terms of consumption inequality. It says India now has one of the lowest levels of inequality globally.
What does the World Bank Report say?
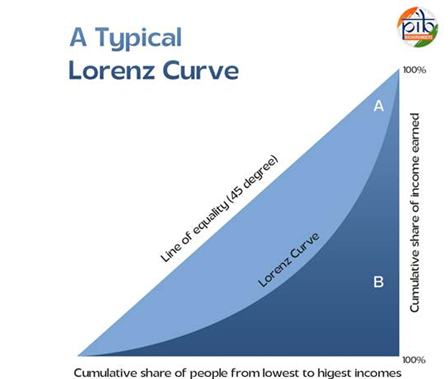
- The report uses the Gini coefficient (a statistical measure of inequality ranging from 0 to 1):
- 0 = perfect equality
- 1 = perfect inequality
- According to the report:
- India’s Gini coefficient fell from 0.288 (2011–12) to 0.255 (2022–23).
- This is based on consumption expenditure data (i.e., how much people spend on goods/services).
- A falling Gini implies less inequality in consumption.
Global Comparison |
|
|
Country |
Gini Index |
|
India |
25.5 |
|
China |
35.7 |
|
USA |
41.8 |
|
Germany |
31.9 |
|
France |
32.7 |
- India ranks 4th globally on the Gini Index of income equality (score: 5) – after Slovak Republic, Slovenia, and Belarus.
- Poverty:The World Bank has also reported significant poverty reduction in India:
- Between 2011 and 2023, about 171 million people exited extreme poverty.
- In 2011, 16.2% of Indians lived on less than $2.15/day (global poverty line).
- By 2022–23, this dropped to just 2.3%.
- Under a revised poverty line of $3/day, poverty stands at 5.3%.
Why is the claim being questioned?
Many experts argue the World Bank data does not show the full picture, because:
- Consumption ? Income or Wealth: Consumption inequality may appear low, but that doesn’t mean income and wealth are equally distributed.For example, subsidies, free ration schemes, and cash transfers can make consumption look equal even when income isn’t.
- Income Inequality Remains Very High: Several studies (e.g., by Thomas Piketty, Lucas Chancel) show that:
- The top 1% in India earn 22% of the national income.
- In contrast, the bottom 50% earn only 13%.
- This has worsened since the 1990s post-liberalisation era.
- Wealth is Highly Concentrated: The top 1% of Indians hold more than 40% of the total wealth.The bottom 50% own just around 3%.A 2024 Oxfam report confirmed these extreme disparities.
|
Targeted policy interventions
What is the Gini Index?
|
More Articles