Environment & Ecology: STATE OF FOREST Report 2019 & Revision Test - II
STATE OF FOREST Report 2019
Introduction
- The report is published by the Forest Survey of India (FSI) which has been mandated to assess the forest and tree resources of the country including wall-to-wall forest cover mapping in a biennial cycle.
- Starting 1987, 16 assessments have been completed so far. ISFR 2019 is the 16th report in the series.
- India is among few countries in the world where forest cover is consistently increasing.
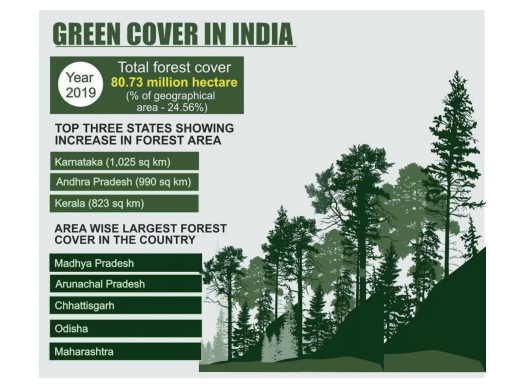
- The total forest and tree cover of the country is 80.73 million hectare which is 24.56 percent of the geographical area of the country.
- Compared to the assessment of 2017, there is an increase of 5,188 sq. km in the total forest and tree cover of the country.
- Out of this, the increase in the forest cover has been observed as 3,976 sq km and that in tree cover is 1,212 sq. km; Range increase in forest cover has been observed in open forest followed by very dense forest and moderately dense forest and the top three states showing increase in forest cover are Karnataka (1,025 sq. km) followed by Andhra Pradesh (990 sq km) and Kerala (823 sq km).”
Some Major Findings of the report
- Area-wise Madhya Pradesh has the largest forest cover in the country followed by Arunachal Pradesh, Chhattisgarh, Odisha and Maharashtra.
- In terms of forest cover as percentage of total geographical area, the top five States are Mizoram (85.41%), Arunachal Pradesh (79.63%), Meghalaya (76.33%), Manipur (75.46%) and Nagaland (75.31%).
- The Mangrove ecosystems are unique & rich in biodiversity and they provide numerous ecological services.
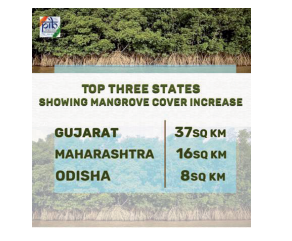
- Mangrove cover has been separately reported in the ISFR 2019 and the total mangrove cover in the country is 4,975 sq km.
- An increase of 54 sq Km in mangrove cover has been observed as compared to the previous assessment of 2017.
- Top three states showing mangrove cover increase are Gujarat (37 sq km) followed by Maharashtra (16 sq km) and Odisha (8 sq km).
- The total growing stock of India’s forest and TOF is estimated 5,915.76 million come of which 4,273.47 million come is inside the forests and 1,642.29 million come outside.
- There is an increase of 93.38 million come of total growing stock, as compared to the previous assessment.
- Out of this the increase in growing stock, there is an increase of 55.08 million come inside the forests and 38.30 million come outside the forest areas.
- The extent of bamboo bearing area of the country has been estimated 16.00 million hectare.
- There is an increase of 0.32 million hectare in bamboo bearing area as compared to the last assessment of ISFR 2017.
- The total estimated green weight of bamboo culms is 278 million tonnes, slowly an increase of 88 million tonnes as compared to ISFR 2017.
- Under the current assessment the total carbon stock in country’s forest is estimated 7,124.6 million tonnes and there an increase of 42.6 million tonnes in the carbon stock of country as compared to the last assessment of 2017.
- The annual increase in the carbon stock is 21.3 million tonnes, which is 78.2 million tonnes CO2 eq.
- Wetlands within forest areas form important ecosystems and add richness to the biodiversity in forest areas, both of faunal and floral species. Due to importance of wetlands, FSI has carried out an exercise at the national level to identify wetlands of more than 1 ha within RFA.
- There are 62,466 wetlands covering 3.8% of the area within the RFA/GW of the country
Methodology
- In tune with the Government of India’s vision of Digital India, FSI’s assessment is largely based on digital data whether it is satellite data, vector boundaries of districts or data processing of field measurements.
- The report provides information on forest cover, tree cover, mangrove cover, growing stock inside and outside the forest areas, carbon stock in India’s forests, Forest Types and Biodiversity, Forest Fire monitoring and forest cover in different slopes & altitudes.
- Special thematic information on forest cover such as hill, tribal districts, and north eastern region has also been given separately in the report.
- The biennial assessment of forest cover of the country using mid-resolution Satellite data is based on interpretation of LISS-III data from Indian Remote Sensing satellite data Resourcesat-II.
- This information provides inputs for various global level inventories, reports such as GHG Inventory, Growing Stock, Carbon Stock, Forest Reference Level (FRL) and international reporting to UNFCCC, targets under CCD, Global Forest Resource Assessment (GFRA) done by FAO for planning and scientific management of forests.
- For the first time, Ortho-rectified satellite data has been used for forest cover mapping due to its better positional accuracy as it removes effects of image perspective (tilt) and relief (terrain) and scale distortions in the image to represent features in its true positions for accurate measurement of distances, angels and areas.
- FSI, in a first ever attempt has carried out a rapid assessment of biodiversity for all the States and UTs (except two) and for all the sixteen Forest Type Groups as per Champion & Seth Classification (1968).
- Apart from the number of tree, shrub and herb species as observed in the survey, Shanon Wienner Index which gives species richness along with the relative abundance, has also been calculated for each forest type groups in each State & UT.
- FSI has carried out mapping of forest types of India as per the Champion & Seth Classification (1968), for the first time in the year 2011 based on the base line forest cover data of 2005.
Other Highlights
- A study to assess the dependence of the people living in close proximity to forests for their day to day needs like fuel wood, fodder, small timber and bamboo was undertaken by FSI.
- The present report also gives information on the fire prone forest areas of different severity classes, mapped in the grids of 5km x 5km based on the frequency of forest fires in the last 14 years that would enable the SFDs to manage and control forest fires effectively in the respective States.
- Non Timber Forest Produce (NTFP) are important source of livelihood for many tribal communities and villagers living in the proximity of forests.
- New information has been generated from the national forest inventory data about the top five NTFP species in each State & UT in terms of their availability in forests i.e. relative occurrence.
- Invasive species pose serious threat to the sustainable management of forests. Analysis of NFI data has been done for determining five major invasive species in each State & UT and also an estimate of area affected by them.
- The information given in the report would provide valuable information for policy, planning and sustainable management of forest and tree resources in the country.
India’s Forests and Forest Resources in the World
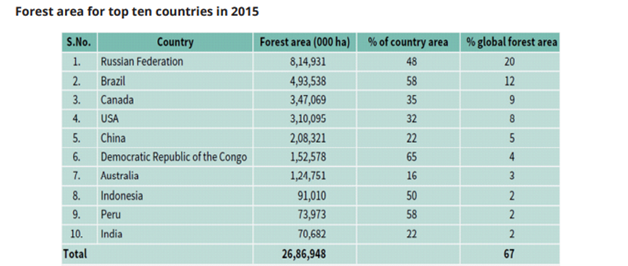
- Global Forest Resource Assessment (FRA) done by FAO once in five years provides information about the forest resources of almost all the countries in the world.
- The latest report of GFRA has been released by FAO in the year 2015.
- Status of the top ten to twelve countries in respect of forest area, change in forest area, growing stock and forest carbon as per the GFRA 2015 are presented as follows.
Objectives of the Nation-Wide Forest Cover Mapping
- To monitor forest cover and changes therein at the National, State and District levels
- To generate information on forest cover in different density classes and changes therein
- To produce forest cover and other thematic maps derived from it for the whole country
- To provide primary base layer for assessment of different parameters including growing stock, forest carbon etc
- To provide information for international reporting
Limitations of the Forest Cover Mapping
- Since the resolution of the LISS III sensor data is 23.5 m, land cover features having a geometric dimension less than 23.5 m on the ground are not discernible.
- Considerable ground details may sometimes be obscured due to clouds and shadows. Such areas can be discerned to a certain extent with the help of collateral data and image processing techniques, but not always.
- Non-availability of appropriate season data sometimes puts constraints on the interpretation of the features owing to poor reflectance of data and phenological changes in forests.
- Occurrence of weeds like lantana in forest areas and agricultural crops like sugarcane, cotton, etc adjacent to forests, causes mixing of spectral signatures and often make precise forest cover delineation difficult.
- Young plantations and tree species with less chlorophyll or inadequate foliage, many a times are not discernable on satellite images due to inadequate reflectance.
- Haze and other atmospheric distortions pose difficulty in interpretation, especially in the coastal areas.
Basel Ban Amendment
Context
Croatia became the 97th country to ratify the ban, which was adopted by the parties to the Basel Convention in 1995.
Background:
- Croatia became the 97thcountry to ratify the ban, which was adopted by the parties to the Basel Convention in 1995, to protect human health and the environment against the adverse effects of hazardous wastes. With Croatia’s ratification, a necessary ¾ of the parties to the Basel Convention have ratified the agreement and has become an international law after Croatia ratified it on September 6, 2019.
Basel Convention:
- The Basel Convention on the Control of Transboundary Movements of Hazardous Wastes and their Disposal was adopted on 22 March 1989 by the Conference of Plenipotentiaries in Basel, Switzerland, in response to a public outcry following the discovery, in the 1980s, in Africa and other parts of the developing world of deposits of toxic wastes imported from abroad.
- It does not address the movement of radioactive waste.
- To implement and restrict the trade of hazardous waste between more developed countries and less developed countries an organization is formed which is known as Basel Action Network (BAN)
The provisions of the Convention center around the following principal aims:
- The reduction of hazardous waste generation and the promotion of environmentally sound management of hazardous wastes, wherever the place of disposal.
- The restriction of transboundary movements of hazardous wastes except where it is perceived to be in accordance with the principles of environmentally sound management.
- A regulatory system applying to cases where transboundary movements are permissible.
The Basel Convention BAN Amendment:
- The Ban Amendment was originally adopted as a decision of the second meeting of the Conference of the Parties in March 1994.
- The “Ban Amendment” provides for the prohibition by Parties listed in Annex VII (members of OECD, EU, Liechtenstein) of all transboundary movements of hazardous wastes including electronic wastes and obsolete ships which are destined for final disposal operations from OECD to non-OECD States.
- According to amendment, it was agreed that such “Annex VII Parties” prohibit and phase out all transboundary movements of hazardous wastes destined for recovery or recycling operations from OECD to non-OECD States by 31 December 1997.
- At COP-3 in 1995, Parties adopted the same as a further amendment to the Convention known as the “Ban Amendment”.
- The Ban Amendment had been stalled for all these years till now due to uncertainty over how to interpret the Convention.
Ratification status of other major countries:
- According to BAN the United States, the world's most wasteful country per-capita, has not ratified the Basel Convention, nor the Ban Amendment
- Other developed countries like Canada, Japan, Australia, and New Zealand, likewise, have e-waste export problems and they too have so far refused to ratify the Ban Amendment.
- South Korea, Russia, India, Brazil, and Mexico are yet to ratify the ban.
National Animal Disease Control Programme
Context
Prime Minister has launched National Animal Disease Control Programme and National Artificial Insemination Programme.
About
- National Animal Disease Control Programme (NADCP) has been launched for eradicating the foot and mouth disease and brucellosis in livestock.
- It aims to control the livestock diseases by 2025 and eradicate these by 2030.
- It aims at vaccinating over 500 million livestock including cattle, buffalo, sheep, goats and pigs against the FMD.
- It also aims at vaccinating 36 million female bovine calves annually in its fight against the brucellosis disease.
Funding: It is a 100% centrally funded programme for a period from 2019 to 2024.
Need:
- Farmer’s Income: Animal Husbandry and other allied activities have a greater role to play in increasing farmers’ income.
- Affects Productivity: Animal diseases impact livestock production through direct costs and indirect costs. In case of Brucellosis, the milk output reduces by 30 per cent during the entire life cycle of animal and also causes infertility among the animals.
- Trade: Brucellosis and FMD disease is common among cattle, buffalo, sheep, goats and pigs and it has a direct negative impact on trade of milk and other livestock products.
- Affects Humans: The infections can also be transmitted to the farm workers and livestock owners.
National Artificial Insemination Programme:
- The Prime Minister also launched the National Artificial Insemination Programme in all the Krishi VIgyan Kendras(KVKs).
- It is launched across the country for vaccination and disease management, Artificial Insemination and Productivity.
Why previous Livestock Extension services failed:
- The trained rural youth were responsible to cater only to 8-15 villages often focused on treatment, mostly on large livestock, rather than preventive practices and awareness building.
- The trained youth who were men most of the time, had a social and psychological barrier in reaching women, who are the caretakers of livestock.
- High travel costs resulted in neglect of close monitoring and administering first aid.
Particulate matter emissions trading
Context
Gujarat became the world’s first market for particulate matter emissions in the world, after 155 industrial units of Surat came together for “live trading” under the Emissions Trading Scheme (ETS)
About
- The programme is a market-based system where the government sets a cap on emissions and allows industries to buy and sell permits to stay below the cap.
- Under the cap and trade system, the regulator first defines the total mass of pollution that can be put into the air over a defined period by all factories put together.
- Then, a set of permits is created, each of which allows a certain amount of pollution, and the total is equal to the cap.
- These permits are the quantity that is bought and sold. Each factory is allocated a share of these permits (this could be equal or based on size or some other rule).
- After this, plants can trade permits with each other, just like any other commodity on the National Commodity and Derivatives Exchange Limited (NCDEX).
- Being initiated in Surat by the Gujarat Pollution Control Board (GPCB), the emission trading scheme (ETS) was designed with the help of a team of researchers from the Energy Policy Institute at the University of Chicago (EPIC), the Economic Growth Center at Yale University and others from The Abdul Latif Jameel Poverty Action Lab (J-PAL).
Significance
- It is the first in the world to regulate particulate air pollution, which is the single greatest threat to human health globally, the state government said.
- It kicks off a new era of cleaner production, while lowering industry compliance costs and rewarding plants that cut pollution in low-cost ways.
- It will prove that rapid economic growth, ease of doing business, and breathing clean air can all be achieved at the same time.
- It has the potential to create lasting changes for the people living in this state, as well as become a benchmark for other states in India and countries across the world
Rashtriya Vayoshri Yojana

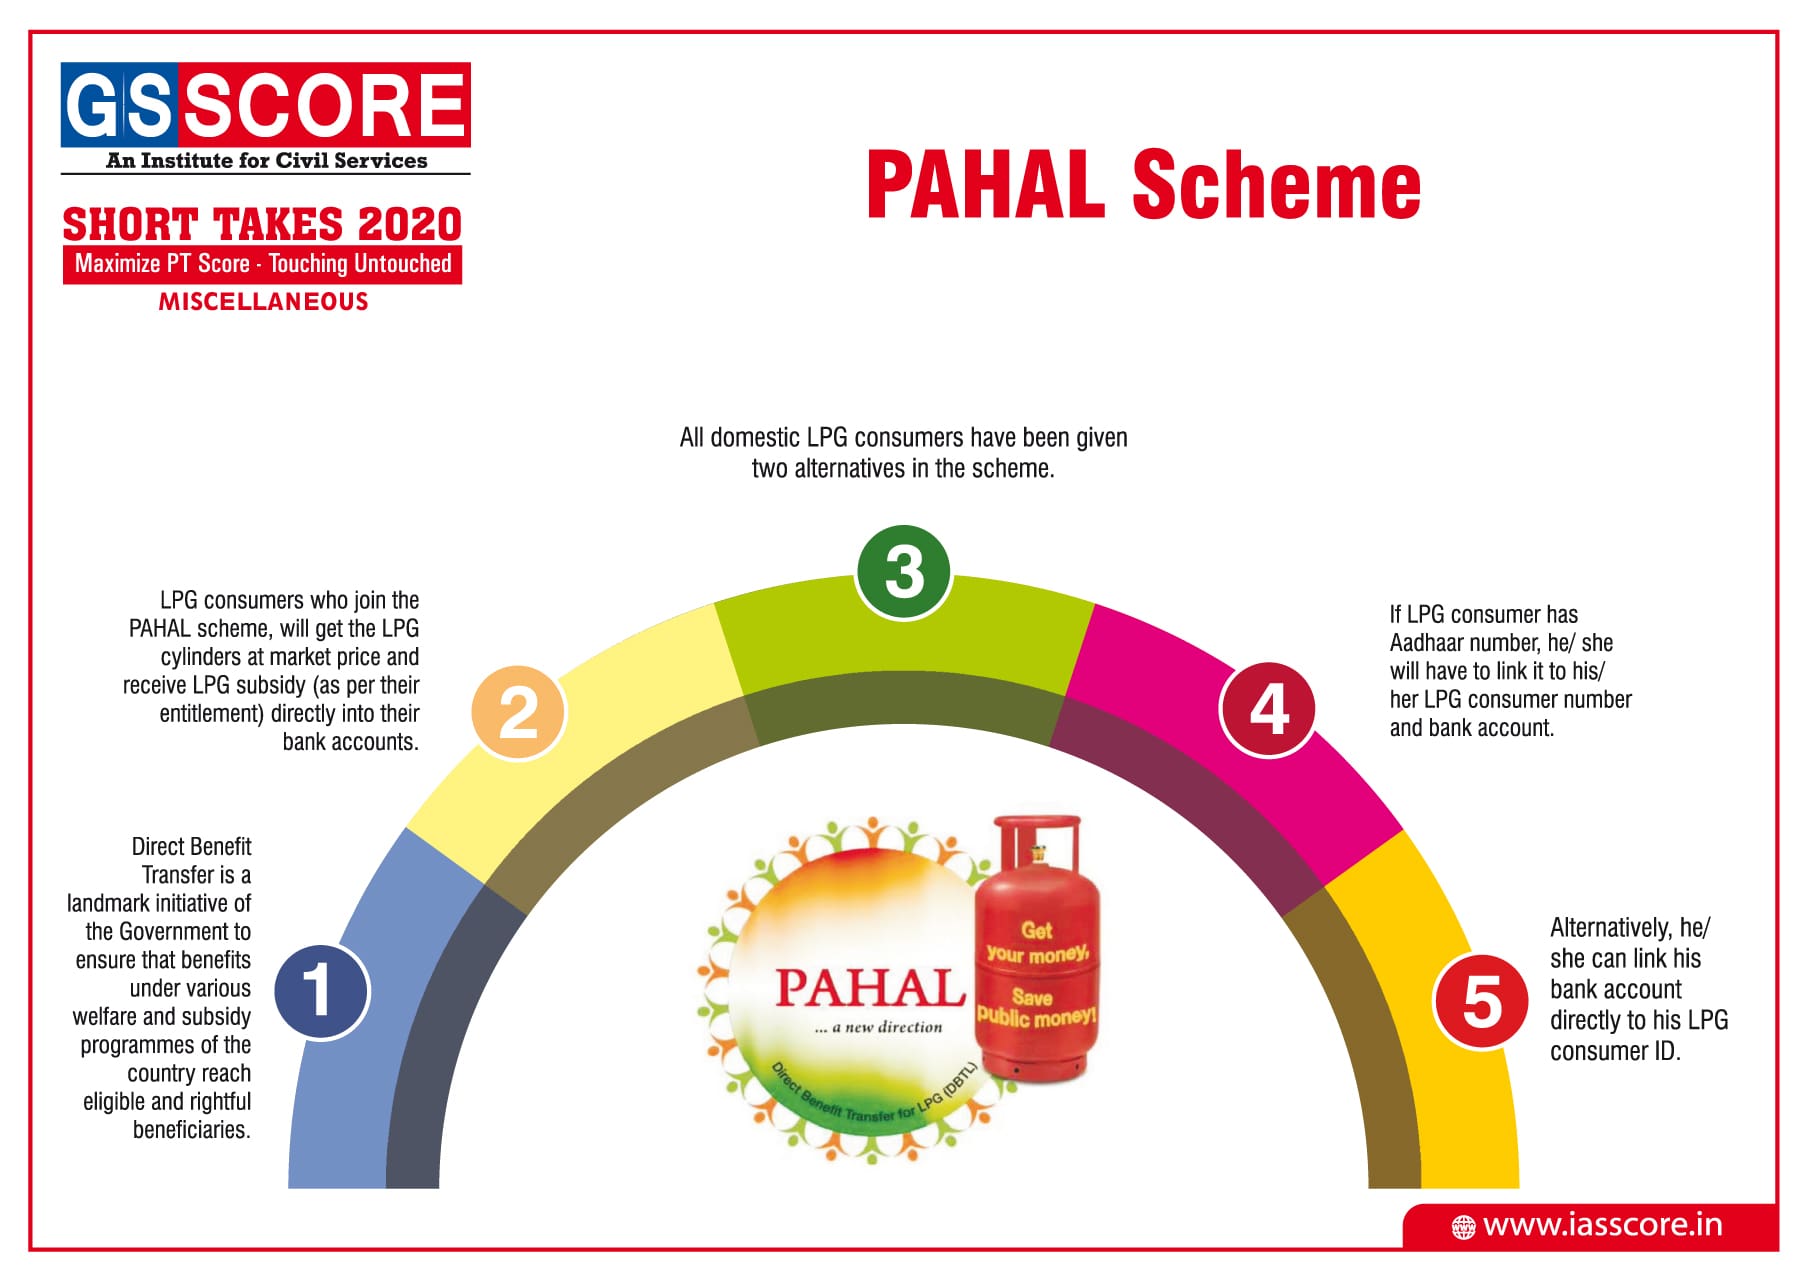
PAHAL Scheme
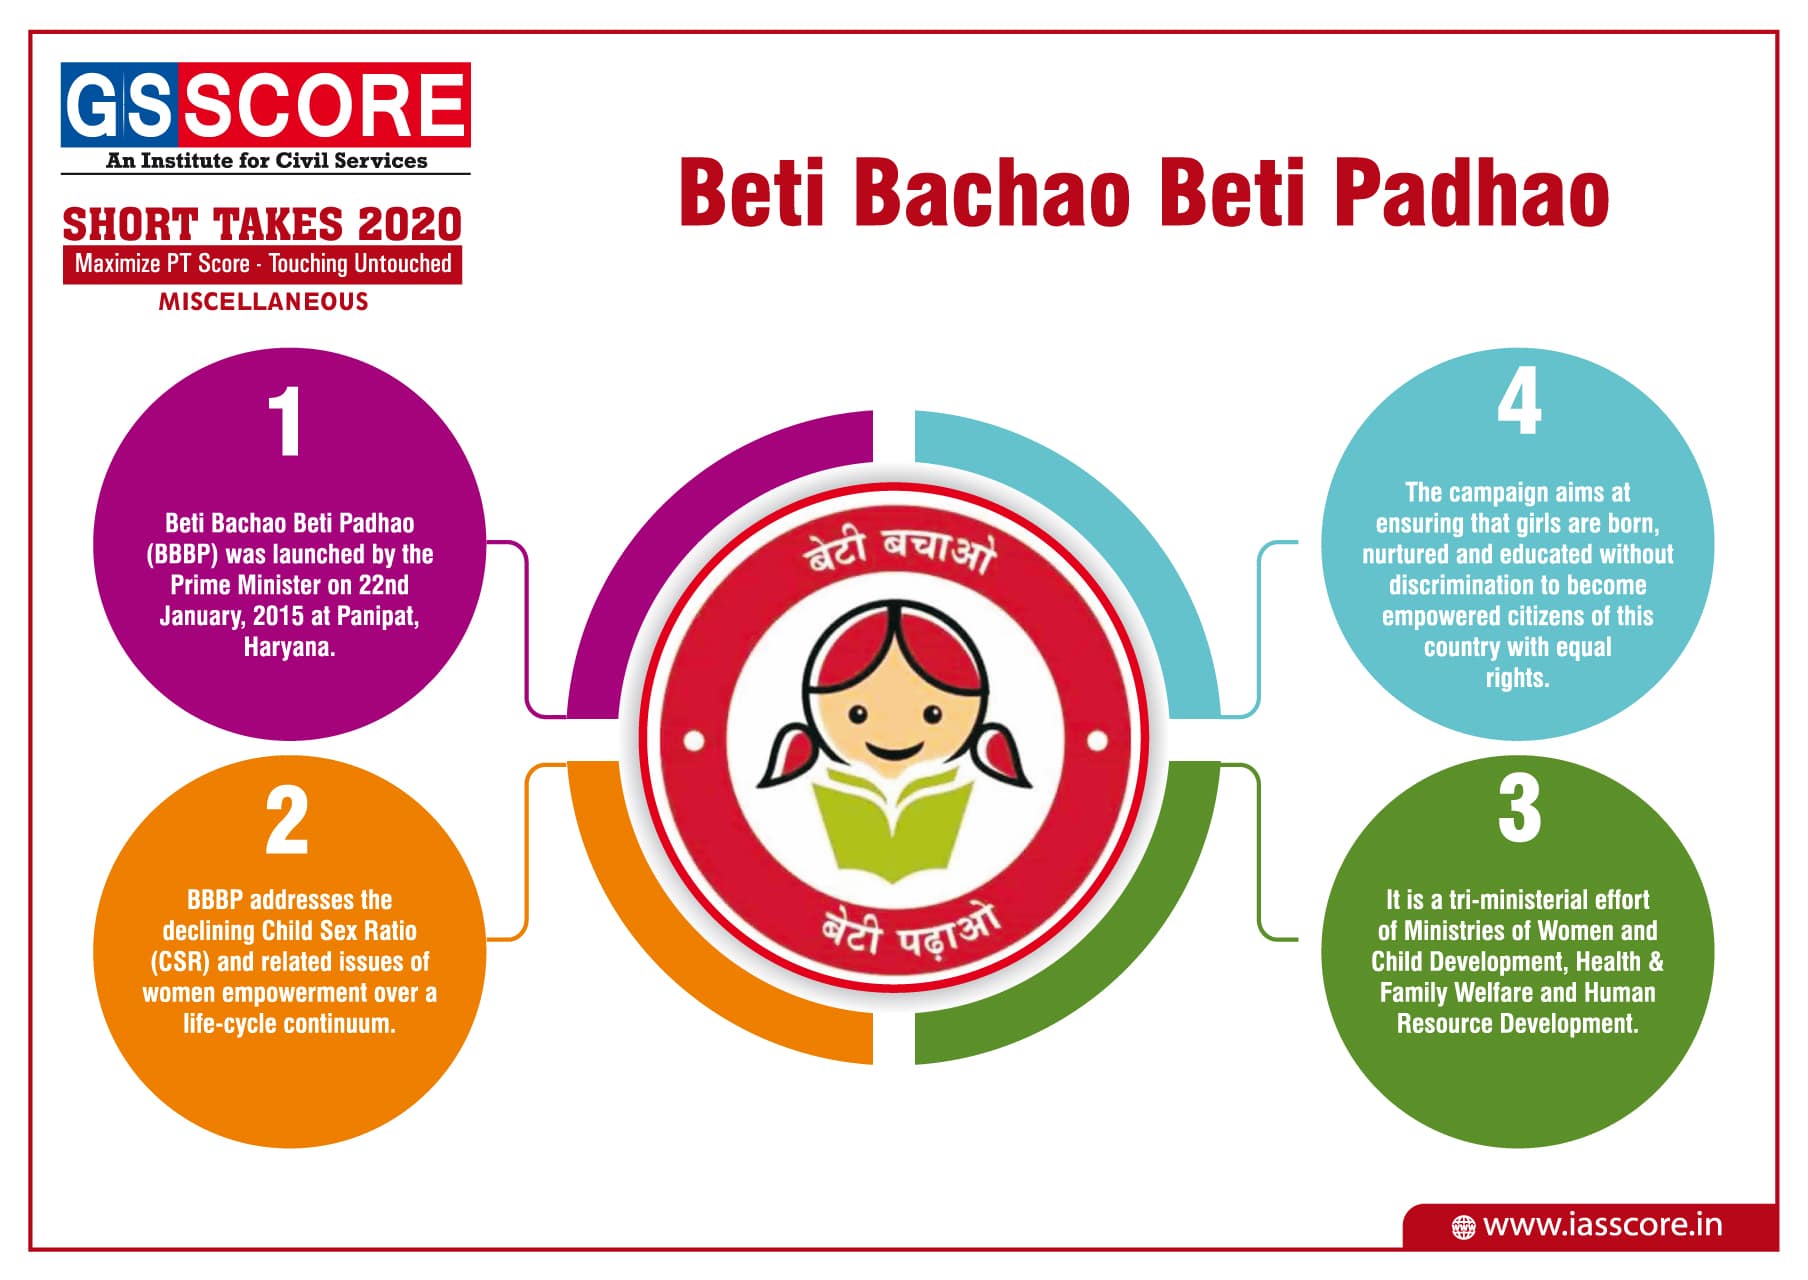
Beti Bachao Beti Padhao
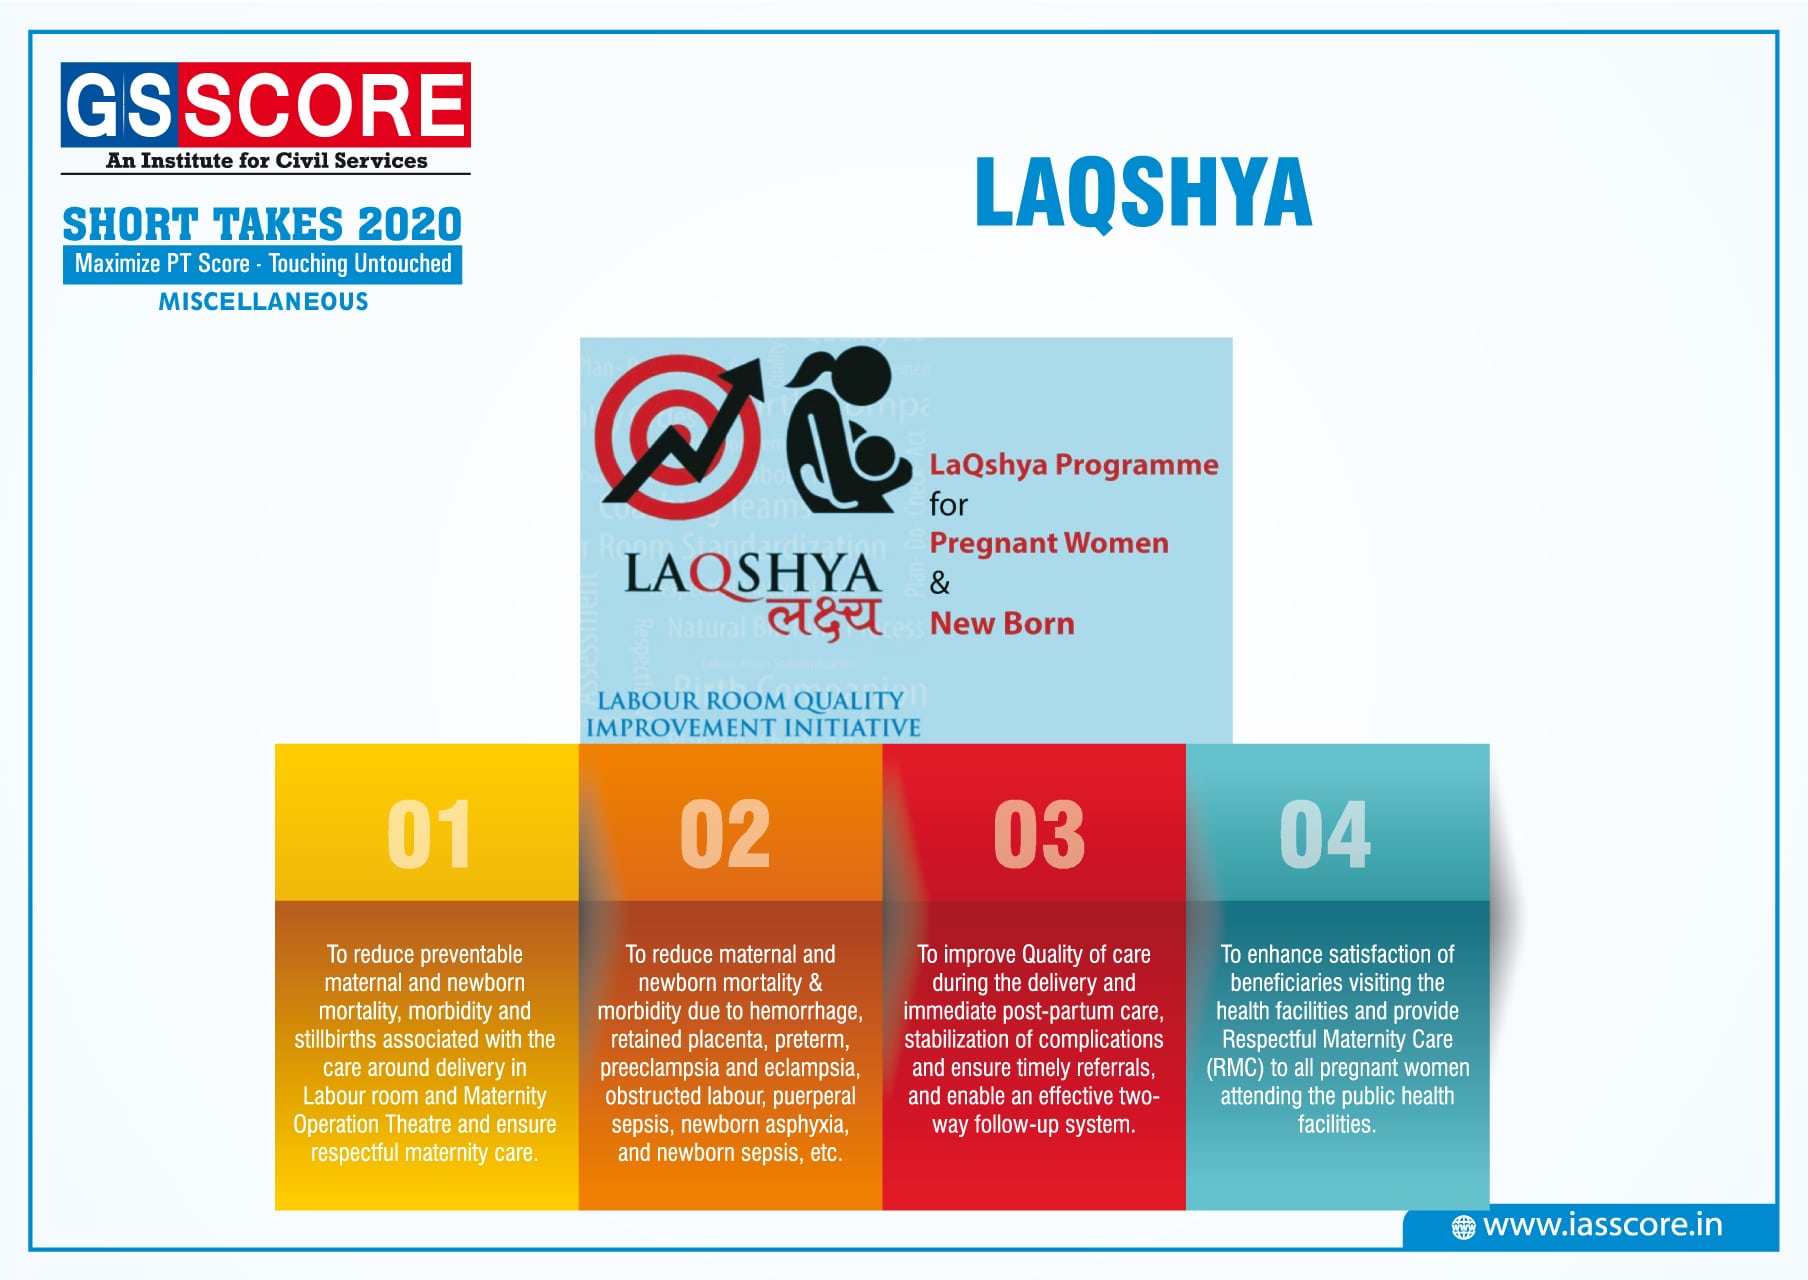
LAQSHYA
Sabka Vishwas (Legacy Dispute Resolution) Scheme
-Scheme-min.jpg)