Economy: Public Finance
FISCAL POLICY
- Fiscal policy is the means by which a government adjusts its spending levels and tax rates to monitor and influence a nation’s economy.
- It is a complimentary strategy to monetary policy (through which a central bank influences a nation’s money supply).
- These two policies are used in various combinations to direct a country’s economic goals.
- Fiscal policy deals with the taxation borrowing and expenditure decisions of the government.
- Fiscal policy is an important constituent of the overall economic framework of a country and is therefore intimately linked with its general economic policy strategy.
Objectives of Fiscal Policy
- In a system of indicative planning, reliance on fiscal policy as an instrument of development is considerable.
- The Planning Commission had stated in the Seventh Five Year Plan that “Though with it the government creates and sustains the public economy consisting of the provision of public services and public investment; at the same time it is an instrument for reallocation of resources according to national priorities, redistribution, promotion of private savings and investments, and the maintenance of stability”.
- Thus, fiscal policy primarily aims at economic growth with price stability. Among other goals of fiscal policies are: capital formation, resource allocation and redistribution for mitigating inequality. It is notable that fiscal policy in a developed country is preoccupied with the problems of business cycle-boom and depression.
- But in a developing economy, tackling business cycle becomes secondary because the prime objective of such economies is capital formation through increased savings and investments in order to achieve high level of economic growth. Further, given scarcity of capital and other resources in a developing economy, it is imperative to allocate resources to various sectors of the economy and heads of development judiciously and in line with development priorities. Fiscal policy helps to achieve these goals.
Types of Fiscal Policy
Expansionary fiscal policy
- It is defined as an increase in government expenditures and/or a decrease in taxes that causes the government’s budget deficit to increase or its budget surplus to decrease. A government can adopt Expansionary fiscal policy on the following basis:
- Government needs to borrow from domestic or foreign sources.
- Print an equivalent amount of money.
- Draws upon its foreign exchange reserves
Drawbacks of this policy
- The flipside of printing is it leads to inflation.
- If the government borrows too much from abroad it leads to a debt crisis.
- If it draws down on its foreign exchange reserves, a balance of payments crisis may arise.
Contractionary fiscal policy
- It is defined as a decrease in government expenditures and/or an increase in taxes that causes the government’s budget deficit to decrease or its budget surplus to increase.
Neutral Fiscal Policy
- It is usually undertaken when an economy is in equilibrium. Government spending is fully funded by tax revenue and overall the budget outcome has a neutral effect on the level of economic activity.
Instruments of Fiscal Policy
- Fiscal policy is carried out by the legislative and/or the executive branches of government. The two main instruments of fiscal policy are:
- Government expenditure
- Taxes
- The effect of government expenditures, taxation, and debt on the aggregate economy is of immense importance. The government collects taxes in order to finance expenditures on a number of public goods and services.
Government Expenditure
Public Expenditure
- It is also known as Government expenditure which can be classified under the following heads:
1. Capital Expenditure
- These are those government expenditures which result in the creation of physical or financial assets or reduction in financial liabilities. These include:
- expenditure on the acquisition of land, building, machinery, equipment, investment in shares, and
- Loans and advances by the central government to State and Union Territory governments, PSUs and other parties.
2. Revenue Expenditure
- These are that expenditure incurred for purposes of day to day expenses rather than the creation of physical or financial assets of the central government. It relates to:
- Expenses incurred for the normal functioning of the government departments and various services;
- Interest payments on debt incurred by the government; and
- Grants given to state governments and other parties.
- Both Capital and Revenue expenditure are also categorized as plan and non-plan in the budget documents.
- Plan expenditure-relates to Expenditure on Central Plans (the Five-Year Plans) and Central Assistance for State and Union Territory plans.
- Non-plan expenditure-covers a vast range of general, economic and social services of the government. The main items of non-plan expenditure are:
- Interest payments
- Defence services
- Subsidies
- Salaries
- Pensions
- Interest payments on market loans, external loans and from various reserve funds constitute the single largest component of non-plan revenue expenditure. Defence expenditure, is committed expenditure in the sense that given the national security concerns, there exists little scope for drastic reduction. Subsidies are an important policy instrument which aim at increasing welfare.
Government Revenue
Government revenue is classified into:
1. Revenue Receipts
- These are those receipts of the government which are non-redeemable, that is, they cannot be reclaimed from the government.
- They are further divided into tax and non-tax revenues
2. Tax Revenue
- Tax Revenues consist of the proceeds of taxes and other duties levied by the central government. Tax revenues are an important component of revenue receipts and comprise of following taxes:
- Income tax: Taxes on individual salaries and income.
- Corporate tax: Taxes on firms and corporations.
- Excise duties: Duties levied on goods produced within the country.
- Customs duties: Duties imposed on goods imported into and exported out of India.
- Service tax: Tax levied by the government on service providers on certain service transactions.
- Wealth tax: Charged on the net wealth of the assesse. It is a tax on the benefits derived from ownership of property.
- Gift tax: Tax on the transfer of property by one individual to another while receiving nothing, or less than full value, in return.
- The tax applies whether the donor intends the transfer to be a gift or not. Taxes like wealth tax, gift tax and estate duty (now abolished) have never been of much significance in terms of revenue yield and have thus been referred to as paper taxes.
- The advantage of the tax is that it raises money for governments.
- Critics argue that the tax will result in fewer financial transactions being made, resulting in job losses in financial centres. Others warn that the tax will mean pension funds and savers get less returns, as banks will simply pass the cost of the tax onto their customers.
3. Non Tax Revenue
- Non-tax revenue mainly consists of:
- Interest receipts on account of loans by the central government;
- Dividends and profits on investments made by the government;
- Fees and other receipts for services rendered by the government; and
- Cash grants-in-aid from foreign countries and international organisations
4. Capital Receipts
- All those receipts of the government which create liability or reduce financial assets are termed as capital receipts.
- The main items of capital receipts are:
- Loans raised by the government from the public which are called market borrowings,
- Borrowings by the government from the Reserve Bank of India (RBI) and Commercial Banks and other Financial Institutions through the sale of treasury bills,
- Loans received from foreign governments and international organisations,
- Recoveries of loans granted by the central government,
- Small savings (Post-Office Savings Accounts, National Savings Certificates, etc),
- Provident funds, and
- Net receipts obtained from the sale of shares in Public Sector Undertakings
The functions that operate through the revenue expenditure measures of the government are: Allocation Function - Expenditure on “Public Goods”:
- Certain goods, referred to as public goods (such as national defence, roads, government administration), as distinct from private goods (like clothes, cars, food items), cannot be provided through the market mechanism, i.e. by transactions between individual consumers and producers and must be provided by the government. This is the allocation function. Note: Public goods are financed through the budget.
Distribution Function:
- Government, through its tax and expenditure policy, attempts to bring about a distribution of income that is considered ‘fair’ by society.
- The government affects the personal disposable income of households by making transfer payments and collecting taxes and, therefore, can alter the income distribution. This is the distribution function.
Stabilization function:
- The economy tends to be subject to substantial fluctuations and may suffer from prolonged periods of unemployment or inflation. There may be times when extra government expenditure is needed to raise aggregate demand.
- There may be times when expenditures exceed the available output under conditions of high employment and thus may cause inflation.
- In such situations, restrictive conditions are needed to reduce demand. These constitute the stabilization requirements of the domestic economy.
Government Budgeting
Budget
- Budget is an Annual Financial Statement of yearly estimated receipts and expenditures of the government in respect of every financial year.
- It acts as instruments of control and act as a benchmark to evaluate the progress of various departments.
- Budgeting is the process of estimating the availability of resources and then allocating them to various activities according to a pre-determined priority.
Types of Budgeting
1. Performance Budgeting
- A Performance Budget gives an indication of how the funds spent are expected to give outputs and ultimately the outcomes.
- A performance budget reflects the goal/objectives of the organization and spells out its performance targets.
- These targets are sought to be achieved through a strategy. Unit costs are associated with the strategy and allocations are accordingly made for achievement of the objectives.
- However, performance budgeting has a limitation – it is not easy to arrive at standard unit costs especially in social programmes, which require a multi-pronged approach.
2. Zero-Based Budgeting (ZBB)
- The concept of ZBB was introduced in the 1970s. As the name suggests, in the process every budgeting cycle starts from scratch.
- Unlike the earlier systems, where only incremental changes were made in the allocation, under zero- based budgeting every activity is evaluated each time a budget is made and only if it is established that the activity is necessary, funds are allocated to it.
- Under the ZBB, a close and critical examination is made of the existing government programmes, projects and other activities to ensure that funds are made available to high priority items by eliminating outdated programmes and reducing funds to the low priority items.
- The basic purpose of ZBB is phasing out of programmes/activities, which do not have relevance anymore. ZBB is done to overhaul the functioning of the government departments and PSUs so that productivity can be increased and wastage can be minimized. Scarce government resources can be deployed efficiently. Therefore, ZBB is followed for rationalization of expenditure.
- Governmental programmes and projects are appraised every year as if they are new and funding for the existing items is not continued merely because a part of the project cost has already been incurred.
3. Programme Budgeting
- It aimed at a system in which expenditure would be planned and controlled by the objective. The basic building block of this system is the classification of expenditure into programmes, which meant objective oriented classification so that programmes with common objectives are considered together.
4. Programme and Performance Budgeting System (PPBS)
- PPBS went much beyond the core elements of programme budgeting and was much more than the budgeting system. It aimed at an integrated expenditure management system, in which systematic policy and expenditure planning would be developed and closely integrated with the budget. Thus, it was too ambitious in scope.
- Many governments today use the “programme budgeting” label for their performance budgeting system. As pointed out by Marc Robertson, the contemporary influence of the basic programme budgeting idea is much wider than the continuing use of the label. It is defined in terms of its core elements as mentioned above. Programme budgeting is an element of many contemporary budgeting systems which aim at linking funding and results. Neither was adequate preparation time given nor was a stage-by-stage approach adopted. Therefore, the Introduction of PPBS in the federal government in USA was not successful, although the concept of performance budgeting and programme budgeting endured.
5. Outcome Budget
- Outcome Budget was first introduced in India in 2005-06 by stating “the people of the country are concerned with outcomes, not just outlays”.
- In 2007-08 onwards the previous Performance Budget was merged with Outcome Budget.
- It is practiced by most of the ministeries while preparing their budget details and submitting it to the Ministry of Finance for the preparation of annual budget towards the end of February.
- It is a performance measurement tool that helps in better service delivery; decision-making; evaluating programme performance and results; communicating programme goals; and improving programme effectiveness.
- It measures the development outcomes of all government programmes.
- It, however, will not necessarily include information of targets already achieved.
- This method of monitoring flow of funds, implementation of schemes and the actual results of the usage of the money is followed by many countries.
6. Gender Budgeting
- Gender Buget was also introduced along with Outcome Budget in India in 2005-06.
- Gender budgeting is an exercise to translate the stated gender commitments of the government into budgetary commitments, involving special initiatives for empowering women and examination of the utilization of resources allocated for women and the impact of public expenditure and policies of the government on women.
- The 2019-20 Budget aims to design a roadmap for woman empowerment and their increased participation in the Indian economy through gender budgeting.
7. Balanced Budgeting
- It is that budget in which Government receipts are equal to Government expenditure.
Merits of the Balanced Budget
- The Government does not indulge in wasteful expenditure.
- Interference in economic functioning of the system is totally avoided by the government generally.
- Financial stability is ensured with balanced budget.
- However, balanced budget is not an achievement of the government when economy is in a state of depression for at that time, government is expected to increase its expenditure with a view to increasing aggregate demand.
Demerits of a Balanced Budget
- It does not offer any solution to the problem of unemployment during depression.
- It is not helpful to the growth and development programmes of the less developed countries.
8. Unbalanced Budgeting
- It is that budget in which receipts and expenditure of the government are not equal.
- It includes two cases: Surplus Budget and Deficit Budget arise.
- In Surplus Budget, Government receipts are greater than Government expenditures. While in the case of Deficit Budget, Government expenditures are greater than Government receipts.
Merits of a Deficit Budget
- It helps in addressing the problem of unemployment during depressions.
- It is conducive for growth and development in less developed countries.
- It works towards social welfare of the people.
Demerits of Deficit Budget
- It shows wasteful expenditure by the government.
- It shows less revenue realization in comparison with the expenditure.
- It increases debt burden of the government
Measures used to record government deficit and their implications for the economy are as follows:
Revenue Deficit
- Revenue deficit refers to the excess of government’s revenue expenditure over revenue receipts (Revenue deficit = Revenue expenditure - Revenue receipts).
- The revenue deficit includes only such transactions that affect the current income and expenditure of the government. When the government incurs a revenue deficit, it implies that the government is dissaving and is using up the savings of the other sectors of the economy to finance a part of its consumption expenditure.
- This situation means that the government will have to borrow not only to finance its investment but also its consumption requirements. This will lead to a build-up of stock of debt and interest liabilities and force the government, eventually, to cut expenditure. Since a major part of revenue expenditure is committed expenditure, it cannot be reduced.
- Often the government reduces productive capital expenditure or welfare expenditure. This would mean lower growth and adverse welfare implications.
- Effective revenue deficit: Revenue deficit - those grants given to states which are used for creation of capital assets.
Fiscal Deficit
- Fiscal deficit is the difference between the government’s total expenditure and its total receipts excluding borrowing.
- Gross fiscal deficit = Total expenditure - (Revenue receipts + Non-debt creating capital receipts)
- The fiscal deficit will have to be financed through borrowing. Thus, it indicates the total borrowing ! requirements of the government from all sources.
- From the financing side: Gross fiscal deficit = Net borrowing at home + Borrowing from RBI + Borrowing from abroad
- Net borrowing at home includes that directly borrowed from the public through debt instruments (for example, the various small savings schemes) and indirectly from commercial banks through Statutory Liquidity Ratio (SLR).
- The gross fiscal defecit is a key variable in judging the financial health of the public sector and the stability of the economy. From the way gross fiscal defecit is measured it can be seen that revenue deficit is a part of fiscal deficit.
- Fiscal Deficit = Revenue Deficit + Capital Expenditure - non-debt creating capital receipts.
- A large share of revenue defecit in fiscal defecit indicated that a large part of borrowing is being used to meet its consumption expenditure needs rather than investment.
Primary Deficit
- Borrowing requirements of the government includes interest obligations on accumulated debt. The goal of measuring primary defecit is to focus on present fiscal imbalances.
- Primary deficit is used to obtain an estimate of borrowing on account of current expenditures exceeding revenues. It is simply the fiscal deficit minus the interest payments.
- Gross primary deficit = Gross fiscal deficit - Net interest liabilities
- Net interest liabilities consist of interest payments minus interest receipts by the government on net domestic lending.
Public Debt
- Budgetary deficits must be financed by either taxation or borrowing or printing money. Governments have mostly relied on borrowing, giving rise to what is called government debt. The concepts of deficits and debt are closely related. Deficits can be thought of as a flow which adds to the stock of debt. If the government continues to borrow year after year, it leads to the accumulation of debt and the government has to pay more and more by way of interest. These interest payments themselves contribute to the debt.
- By borrowing, the government transfers the burden of reduced consumption on future generations. This is because it borrows by issuing bonds to the people living at present but may decide to pay off the bonds some twenty years later by raising taxes.
- These may be levied on the young populations that have just entered the work force, whose disposable income will go down and hence consumption. Thus, national savings, it was argued, would fall. Also, government borrowing from the people reduces the savings available to the private sector. To the extent that this reduces capital formation and growth, debt acts as a ‘burden’ on future generations.
Fiscal Responsibility and Budget Management (FRBM) Act
- Enacted in 2003, the FRBM Act requires the elimination of revenue deficit by 2008-09. This means that from 2008-09, the government will have to meet all its revenue expenditure from its revenue receipts. Any borrowing would then only be to meet capital expenditure - repayment of loans, lending and fresh investment.
- The Act also mandates a 3% limit on the fiscal deficit after 2008-09. This is a reasonable limit that allows significant-cant leverage to the government to build capacities in the economy without compromising fiscal stability.
- It is important to note that since the entire Budget is at current market prices the deficits are also calculated with reference to GDP at current market prices. The main features of the bill are as follows:
- The Fiscal Responsibility and Budget Management (FRBM) Bill was introduced in December 2000 and enacted in August 2003. The rules are effective from July 5, 2004 and the government is now committed to implement the FRBM act. Following are the main features of the FRBM Act:
- The Act stipulates the elimination of revenue deficit by March 31, 2008.
- According to the Act, the revenue deficit is to be reduced by a minimum of 0.5% of GDP per annum and the fiscal deficit by 0.3%. The rolling targets of FRBM provide for a reduction in the revenue deficit to 1.5% in 2005-06 and to 1.1% in 2006-07 and eventually to zero in 2008.
- The FRBM Act also caps the level of guarantees and prohibits government to borrow from the RBI after April 1, 2006.
- The Act requires that on a quarterly basis, the Government would have to place before both the Houses of Parliament an assessment of trends of receipts and expenditure. The Government also has to annually present the macro-economic framework statement, medium term fiscal policy statement and fiscal policy strategy statement. The three statements would provide the macroeconomic background and assessment relating to the achievement of FRBM goals.
- The medium term fiscal policy statement will contain a three-year rolling target for key fiscal parameters that underpin the Government’s fiscal correction trajectory.
- Through the FRBM discipline, the Government is also committed to undertake an intra-year assessment of the achievement of its budgetary targets. During the Economy Crisis of 2008, the FBRM guidelines were not followed rigorously but now government is committed for reducing the deficits.
Deficit Financing
- Excessive domestic borrowing by the government may lead to higher real interest rates and the domestic private sector being unable to access funds resulting in the crowding out of private investment. Sometimes a combination of these can occur.
- In any case, the impact of a large deficit on long run growth and economic well-being is negative.Therefore, it is not prudent for a government to run an unduly large deficit.
- However, in case of developing countries, where the need for infrastructure and social investments may be substantial, running surpluses at the cost of long-term growth might also not be wise.
- The challenge then for most developing country governments is to meet infrastructure and social needs while managing the government’s finances in a way that the deficit or the accumulating debt burden is not too great.
- Deficit Financing is a practice in which a government spends more money than it receives as revenue, the difference being made up by borrowing or minting new funds.
- Although budget deficits may occur for numerous reasons, the term usually refers to a conscious attempt to stimulate the economy by lowering tax rates or increasing government expenditures.
What is Fiscal Stimulus?
- Fiscal or Economic Stimulus are attempts by government to financially stimulate an economy.
- An economic stimulus is the use of monetary or fiscal policy changes to kick start a lagging or struggling economy.
- Example: Governments can adopt practices such as lowering interest rates, increasing government spending and quantitative easing, to name a few, to accomplish this.
Effects of Fiscal Policy on Macro Economy
- Fiscal policy affects aggregate demand, the distribution of wealth, and the economy’s capacity to produce goods and services. In the short run, changes in spending or taxation can alter both the magnitude and the pattern of demand for goods and services. With time, this aggregate demand affects the allocation of resources and the productive capacity of an economy through its influence on the returns to factors of production, the development of human capital, the allocation of capital spending, and investment in technological innovations.
- Tax rates, through their effects on the net returns to labour, saving, and investment, also influence both the magnitude and the allocation of productive capacity. Fiscal policy also feeds into economic trends and influences monetary policy.
Effects of Fiscal Policy on Consumer Spending
- Lower taxes, everything else being constant, increase households’ disposable income, allowing consumers to increase their spending. The consequences of the cut - how much is spent or saved, and the response of economic activity - depend on the way households make their decisions and on prevailing macroeconomic conditions.
- Whether the tax cut is perceived to be temporary or permanent will influence how much consumers save. A temporary cut will alter households’ disposable income relatively little, and so might have little effect on consumption. If the cut is, instead, perceived to be permanent, then households will perceive a larger increase in their disposable income and so will likely increase their desired consumption by much more than they would if they thought the cut were temporary.
- There is a potential conflict between the use of fiscal policy to stimulate aggregate demand when the economy is operating below potential in the short run and the use of policy to promote longer-run goals for national saving and capital formation to improve future living standards. When there are underutilized economic resources, fiscal stimulus can increase investment. But when the economy is operating near potential, an increase in the public debt might eventually depress private investment, unless the fiscal stimulus is reversed as the economy approaches full employment and utilisation.
- This fiscal drag has the effect of reducing Aggregate Demand and becomes an example of deflationary fiscal policy. It could also be viewed as an automatic fiscal stabiliser because higher earnings growth will lead to higher tax and therefore moderate inflationary pressure in the economy.
Limitations of Fiscal Policy
- There are significant time lags
- Recognition lag: time it takes government to recognize there is a problem
- Decision lag: time required for government to determine most appropriate policy
- Implementation lag: time it takes to figure out how to implement new directives
- Impact lag: time it takes to be felt through multiplier effect
- There are difficulties in changing spending and taxation policies
- It is far easier to increase spending and decrease taxes then to increase taxes and decrease spending
- There is a conflict between levels of government over appropriate policies
- Federal, provincial and city governments may differ on what needs to be done.
- Regional variations
- There is crowding out of private investment
- Increases interest rates
- Reduces amount of funding for private investment
- Deficits impose burden on future generations and Foreign-owned debt removes capital from economy
Falling Index of Industrial Production
Context
Recently the Index of Industrial Production (IIP) reached to a low of –4.3% (September 2019). It was exacerbated by a manufacturing slowdown of –1.4%. This is the deepest negative growth in the 2011-12 series; more than seen in the previous 2004-05 IIP series.
About
- There is sharp contraction in the IIP (factory output), to an eight-year low of a negative 4.3% year-on-year (y-o-y).
- In terms of industries, 17 out of the 23 groups in the manufacturing sector
- Core sector data measuring the eight infrastructure sectors contracted2%, worst in 14 years. Core sector constitutes 40% of industrial production.
- All components of industrial output—mining, manufacturing and electricity—fell during the month, pointing towards a deepening economic downturn.
- The top negative contributors to negative IIP were mining, bars and rods of alloys and stainless steel, auto parts, commercial vehicles and two-wheelers.
- Demand is clearly weaker than perceived and consumer confidence is severely dented. Business confidence has slipped to lowest level in past two years.
- Signalling a continuing slump in consumption demand, both consumer durables and consumer non-durables also contracted.
- There is contraction also in capital goods segment (driven largely by commercial vehicles (CVs)) indicating that investment demand in the economy is shrinking, and that companies are not adding capacity.
- The pace of growth of intermediate goods such as cotton yarn, plywood and steel pipes halved to 7%.
- The IHS Markit’s purchasing managers’ index (PMI), based on a survey of 400 producers, also fell. Job creation fell to a six-month low, while companies were reluctant to hold excess stock and lowered input buying.
- Auto manufacturers have been producing less in order to reduce inventories that piled up earlier.
- The infrastructure and construction sectors have been sluggish for a long time now.
- Key sectors such as defence have attracted little FDI.
- Highest positive contributors to IIP were basic metals (driven largely by mild steel slabs), fragrance and oil essentials, hot-rolled coils, electric heaters and medicinal formulations.
- MS Slabs are used in the hydraulic press and machinery industry. This explains the growth in the intermediate goods user industry segment, which some analysts say will contribute to imminent recovery of IIP.
Reasons for fall in IIP
- Tight credit conditions are making it hard for all, except for top-rated borrowers, to access loans at affordable rates. This is hurting demand and business.
- After the NBFC crisis, companies and individuals have been finding it harder to get affordable loans; disbursements by NBFCs and HFCs fell 32% y-o-y in Q2FY20. Overall loan growth seems to have slumped to 6%.
- One can’t blame lenders for being risk-averse, since it is a fact that credit profiles of most companies are far from robust and, in many cases, are deteriorating.
- The sharp IIP de-growth was, in large part, due to a persistent negative growth in capital goods.
- IMF and other agencies have downgraded India’s growth forecast, which is emanating mostly from slowdown in manufacturing segment. Sectors in manufacturing segment where growth contracted were mining, electricity generation, petroleum and consumer durables.
- Growth in mining contracted due to the excess, prolonged rains in the mining belts.
- Negative growth in petroleum refining might have been due to some maintenance related refinery closures.
- Weaknesses in consumer non-durables (FMCG) are representative of squeezed purchasing power, and hence, demand weakness.
- Contraction in electricity generation has been led by multiple factors, including weaker demand from industry, curtailed production schedules, low domestic demand and farm off-take related to higher than normal rainfall.
- Global economy is also suffering from low growth conditions, and its affect gets amplified for emerging markets like India.
- Diesel consumption has sharply decelerated and a continuing vehicle sales slowdown will inevitably impact transport activity in an adverse way.
- The late withdrawal of the monsoon is likely to have dampened construction activity in various states, contributing to the contraction in the output of infrastructure/construction goods.
- Seven out of the eight core industries showed a contraction. Coal was the worst performer on account of an extended monsoon, a surge in renewable energy supply and labour issues at state-run Coal India Ltd. Coal accounts for a substantial share of the freight moved by the Indian Railways and the country’s power generation capacity. Of India’s installed capacity of 360 GW, 54% is coal-fuelled.
- Slowdown in growth of intermediate goods stands out as the biggest contributor to the sequential slippage in IIP growth.
- Weakening demand had a domino effect on the manufacturing industry, knocking down production, employment and business sentiment.
Solutions to revive IIP
- Without an investment revival, there is little hope of the economy clocking more than 6%.
- Even as the government works on longer-term measures to revive the economy, it must find a way for businesses and individuals to be able to access loans and, at the same time, speed up payments so cash flows back into the economy.
- The onus is on the government to spend more; schemes such as the Rs. 25,000 crore funds for the real estate sector to complete stalled housing projects will boost cement and steel sectors and will go some way in reviving demand.
- However, over the longer term, government must ensure that regulation is unbiased; else, we will see wealth destruction of a colossal magnitude as we have seen in telecom.
- The Reserve Bank of India has slashed its policy rates for the fifth time this year (as of November 2019) to support growth.
- There is need to design an optimal mix of policies to reverse this deceleration. The scope for a strong monetary policy response is limited.
- The administration has given a cut in the corporate tax rate. This too will prompt companies to invest more.
Conclusion
The Indian economy is battling a severe demand slowdown and a liquidity crunch, which together resulted in the GDP growth rate and growth in private consumption expenditure falling. The slowdown in the economy is likely to have an adverse bearing on policymakers’ goal of doubling the size of the economy to $5 trillion by 2024. Hence, it is important to arrest the falling industrial production at the earliest, in order to revive growth.
OECD tax proposal (BEPS 2.0)
Context
OECD has proposed a new multilateral framework on taxation of new-age companies such as Netflix, Uber, Google and Facebook, which have a large customer base in developing countries like India as well as the EU.
About
- The OECD tax proposal aims to prevent digital Multinational Enterprises (MNEs) artificially showing profits in low-tax countries instead of where deal happens.
- The proposal requires them to pay tax wherever they have significant consumer-facing activities (market) and where they generate their profits, and not based on jurisdiction of their physical presence.
- The new OECD proposal brings together common elements of three competing proposals from member countries:
- A user participation proposal;
- A marketing intangibles proposal and;
- A significant economic presence proposal (as proposed by India).
- OECD tax proposal: The proposal would re-allocate some profits and corresponding taxing rights to countries and jurisdictions where MNCs have their markets. It would ensure that MNEs conducting significant business in places where they do not have a physical presence, are taxed as per the following new unified rules:
- Where tax should be paid (“nexus” rules; which are largely dependent on sales)
- What portion of profits should be taxed (“profit allocation” rules)
- The proposal is based on the work of OECD/G20 Inclusive Framework on Base Erosion and Profit Sharing (BEPS).
- Discussions on the new proposal are in pipeline (as of November 2019) and all countries must agree for the rules to be enforced.
Objectives of the new OECD tax proposal
- The idea of the proposal is to address the tax challenges arising from digitalisation of the economy and the rise of complex, global corporate tax structures.
- Changing nature of work, including automation, artificial intelligence and the rise of the gig economy, can erode tax revenues so severely that it may difficult to provide essential state services by 2040.
- The initiative aims to advance toward a consensus-based solution to overhaul the rules-based international tax system by 2020.
- The ultimate goal is to ensure that all MNEs pay their fair share of tax.
- The proposal aims to balance adherence to the arm's-length principle with formula based solutions.
- Failure to reach agreement by 2020 would greatly increase the risk that countries will act unilaterally, with negative consequences on an already fragile global economy.
- The proposal is part of wider efforts to restore stability and certainty in the international tax system, address possible overlaps with existing rules and mitigate the risks of double taxation.
- Beyond the specific elements on reallocating taxing rights, a second pillar of the work aims to resolve remaining BEPS issues, ensuring a minimum corporate income tax on MNE profits.
- Together, the OECD anticipates that these proposals will lead to a significant increase in global tax revenues.
Why is India’s take on the OECD tax proposal?
- India had sought changes in the proposal on digital taxation, saying it would deny the country its proper share of taxes from multinationals such as and Netflix, which generate substantial revenues locally.
- The proposed OECD formulation meant India getting little revenue despite the large digital and business presence of companies. This is because only “residual profit” will be apportioned among the countries where a company has its markets.
- Government is of the view that MNEs derive large revenues from countries such as India via their digital presence, without having a physical one, and has questioned the distinction between “routine profits”— which accrue due to physical presence — and “residual profits”.
- For example, a cab aggregator (like Uber) operating via a mobile app has its core technology base in one country and software base in another but makes money in countries such as India. Hence the Indian method focuses on place of revenue generation.
- 28 developing nations backed India on its objection to the OECD tax proposal.
- Grouping believes new global rules to tax tech giants give undue taxation rights to United States.
- India's draft report on profit attribution gives weightage to sales and users as a factor for profit attribution. If finalised, it would result in higher revenues for countries like India having a large user base but a very low share in the value chain. This would be a vastly increased tax base.
- Most importantly the scope of the new proposal extends now from just digital business to all consumer-facing business. This is a very significant expansion as market is an important component and deserves to be a factor for profit allocation.
Steel Scrap Recycling Policy
Context
The government released Steel Scrap Recycling Policy that aims to reduce imports, conserve resources and save energy.
About
- The Steel Scrap Policy will ensure processing and recycling of products in an organized, safe and environment friendly manner.
- It will evolve a responsive ecosystem to produce high quality ferrous scrap for quality steel production minimizing the dependency on imports.
- It envisages a framework to facilitate and promote establishment of metal scrapping centers in India that will boost steel production.
- It also aims to decongest the Indian cities from reuse of ferrous scrap, besides creating a mechanism for treating waste streams and residues produced from dismantling and shredding facilities.
- The country's steel scrap imports were valued at Rs 24,500 crore in 2017-18, while the deficit was to the tune of 7 MT.
- The policy is based on "6Rs principles of Reduce, Reuse, Recycle, Recover, Redesign and Remanufacture through scientific handling, processing and disposal of all types of recyclable scraps including non-ferrous scraps, through authorized centers / facility".
- The gap between demand and supply of scrap can be reduced in the future and the country may be self-sufficient by 2030.
- National Steel Policy 2017 aims to develop a globally competitive steel industry by creating 300 MT per annum steel production capacity by 2030 with a contribution of 35-40 per cent from EAF/IF (Electric Arc Furnace/Induction Furnace) route.
Significance
- The scrapping policy ensures that quality scrap is made available for the steel industry.
Scrap is an important input for the electric furnaces. If quality scrap is provided as the charge to the electric furnaces, then the furnaces can produce high grade steel. High grade steel scrap shall not have the impurities if processing is done with the scrap processing centers and by shredders etc. - It will minimize the cost of production and will lead to costlier steel.
- Conservation of environment, energy and Natural resources: There is a worldwide trend to increase steel production using scrap as the main raw material as recycling of scrap helps in conservation of vital natural resources besides other numerous benefits. The use of every tonne of scrap shall save 1.1 tonne of iron ore, 630 kg of coking coal and 55 kg of limestone. There shall be considerable saving in specific energy consumption also.
- The availability of scrap is a major issue in India and in 2017 the deficit was to the tune of 7 MT which gives us an opportunity to exploit it. This was imported at the cost of more than Rs 24,500 crore in 2017-18.
- The current supply of scrap is 25 MT from the domestic unorganized scrap industry and 7 MT from import of scrap. There is potential to harness this huge quantity scarp for steel production.
- It is in tune with the National Steel Policy that aims to develop a globally competitive steel industry by creating 300 MT per annum steel production capacity by 2030 with a contribution of 35-40 per cent from EAF/IF (Electric Arc Furnace/Induction Furnace) route.
- It will reduce India’s dependence on steel imports.
Pradhan Mantri Rojgar Protsahan Yojana (PMRPY)
-min.jpg)
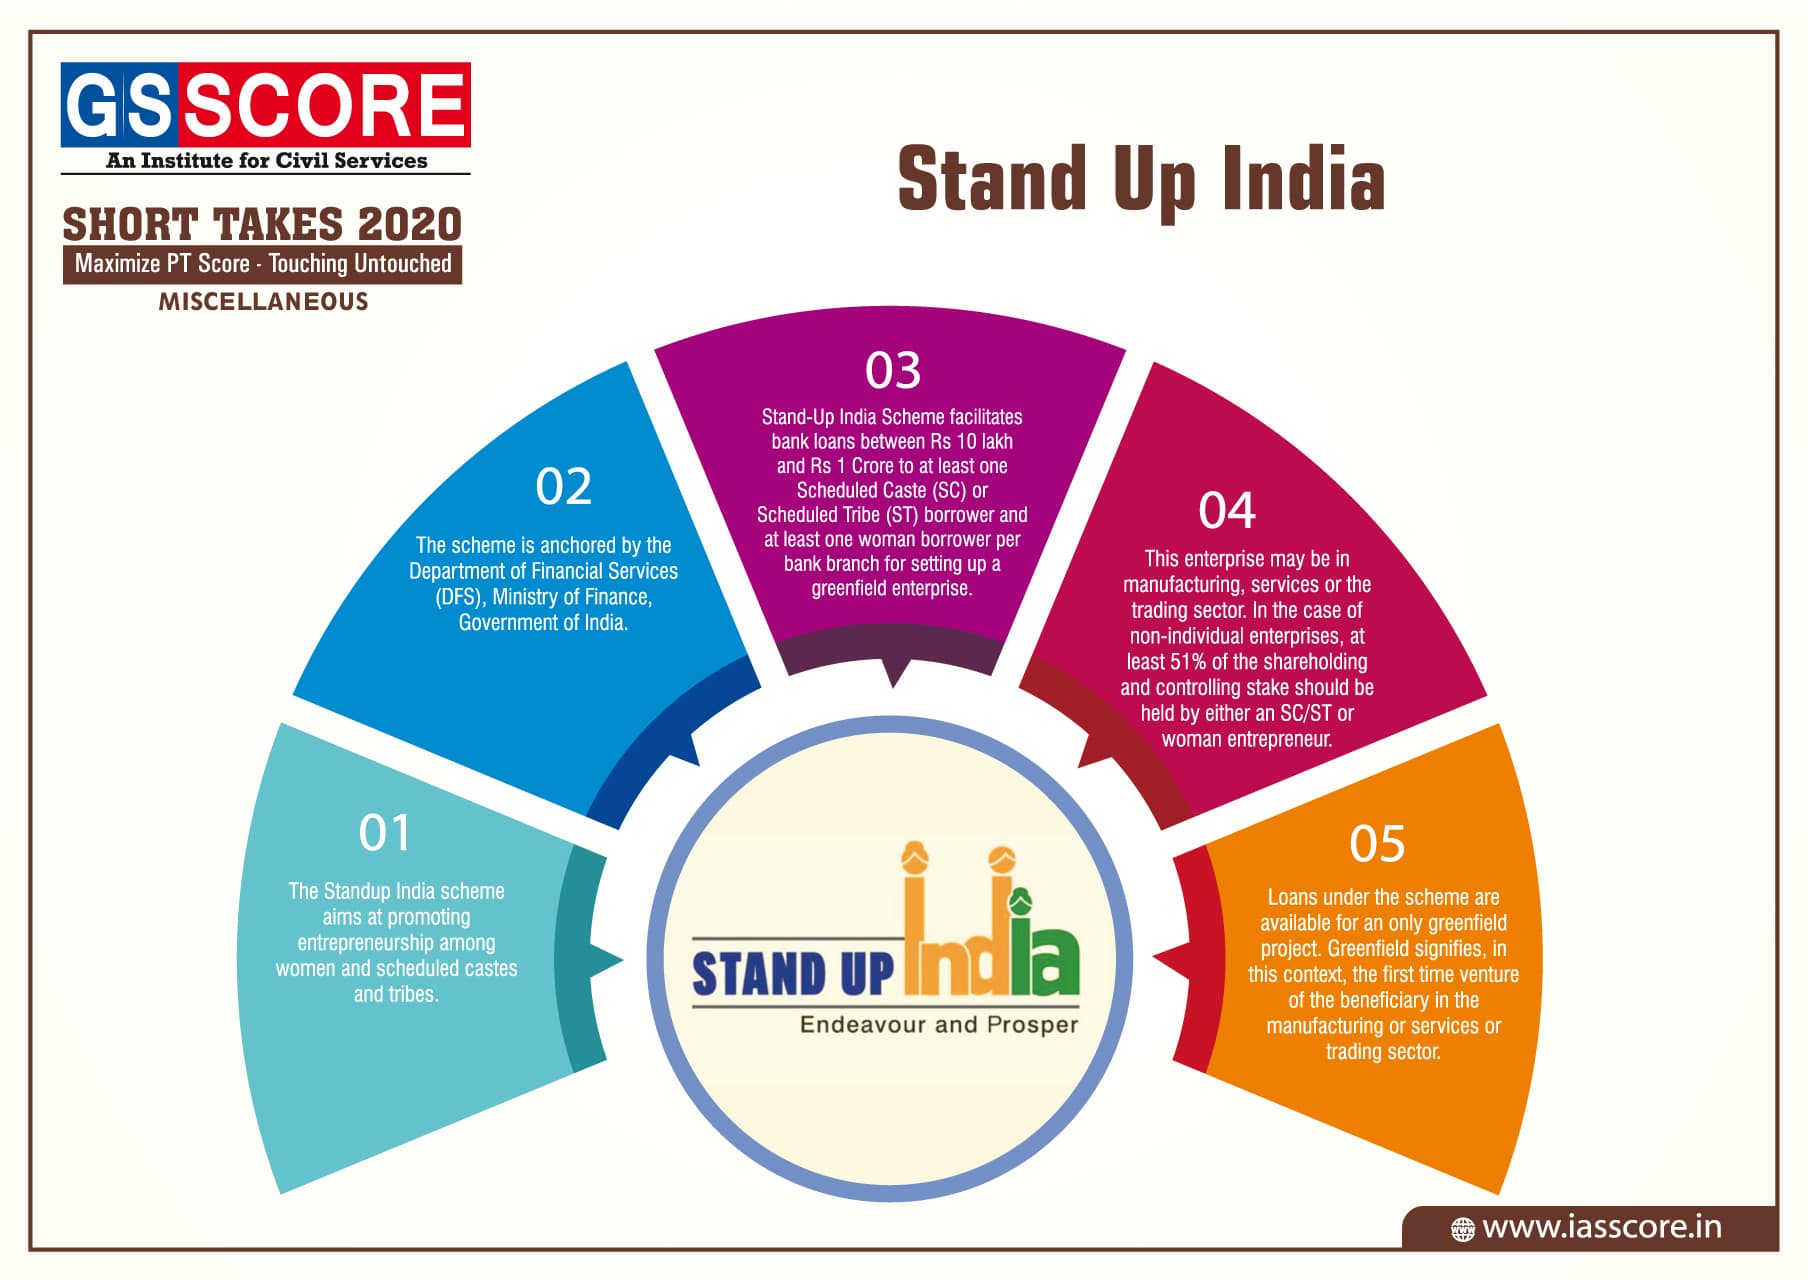
Stand Up India
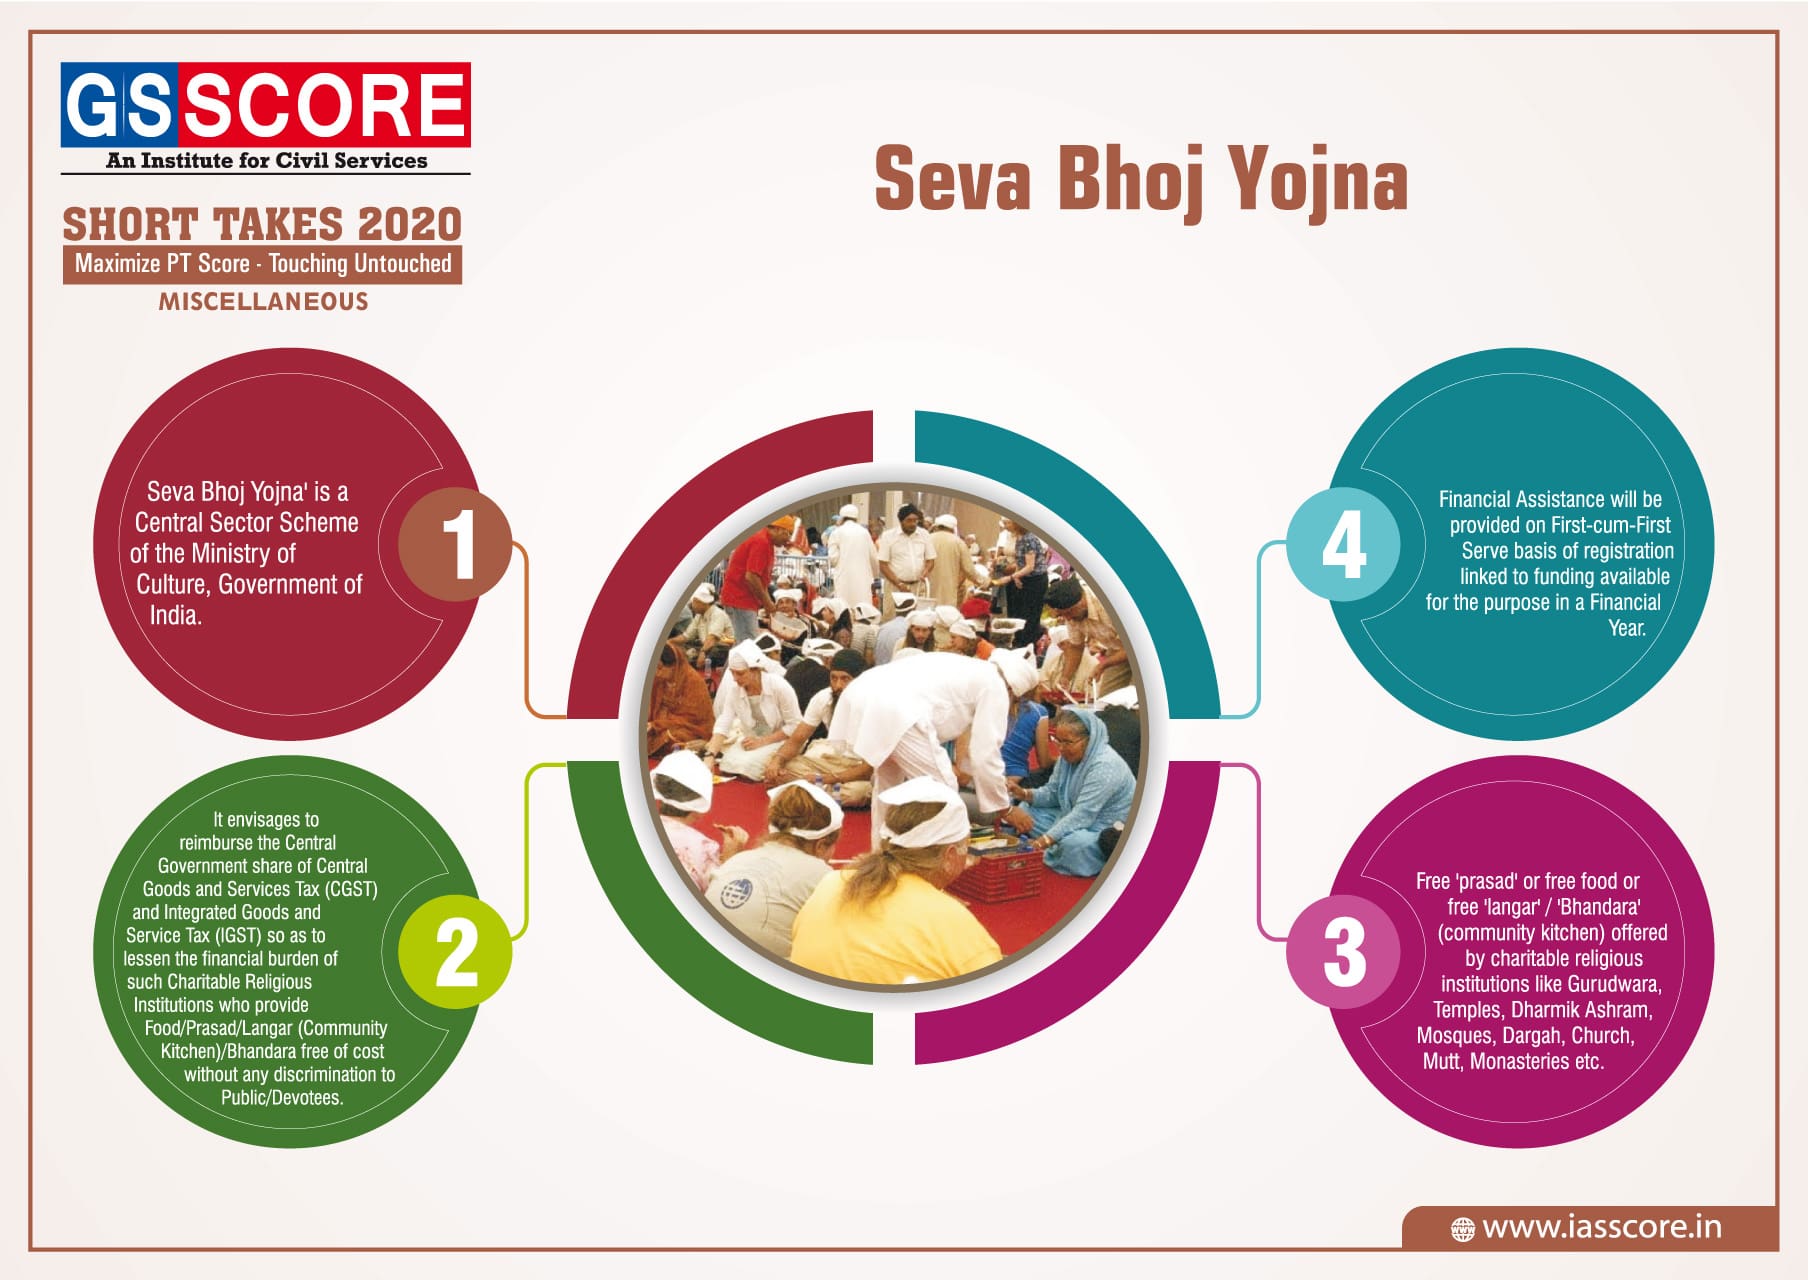
Seva Bhoj Yojna
National Investigation Agency (Amendment) Bill, 2019
-Bill,-2019-min1.jpg)
Protection of Human Rights (Amendment) Bill, 2019
-Bill,-2019-min1.jpg)