

8th October 2024 (13 Topics)
1
Oct
2
Oct
3
Oct
4
Oct
5
Oct
7
Oct
8
Oct
9
Oct
10
Oct
11
Oct
12
Oct
14
Oct
15
Oct
16
Oct
17
Oct
18
Oct
19
Oct
21
Oct
22
Oct
23
Oct
24
Oct
25
Oct
26
Oct
28
Oct
29
Oct
30
Oct
31
Oct
Growth of India’s Agricultural Sector
Context
India's agricultural sector has shown notable growth over the past two decades, especially in the last ten years. This growth has been analyzed in a recent paper published by NITI Aayog, focusing on the performance of the sector in terms of Gross Value Added (GVA).
Key Findings on Agricultural Growth
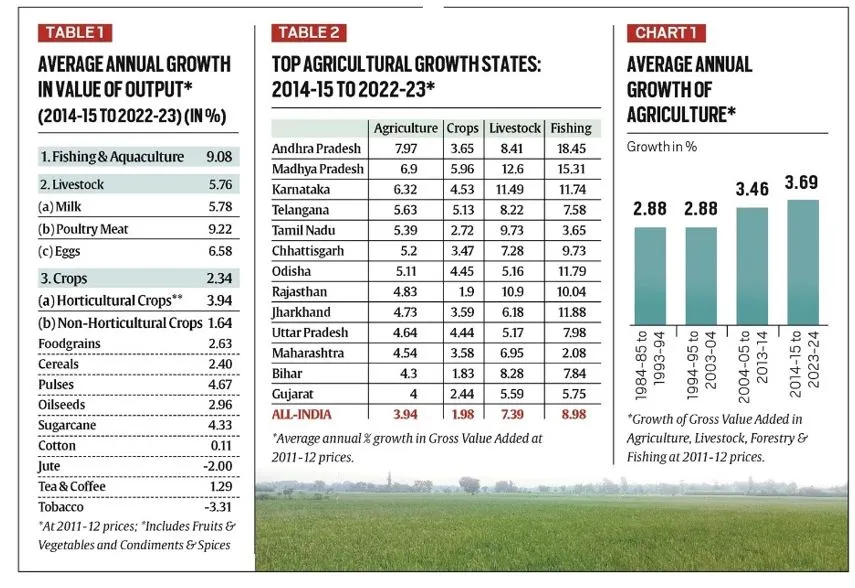
- Growth Rates Over Time:
- 1984-85 to 1993-94: The average annual growth rate for agriculture was 9%.
- 1994-95 to 2003-04: The growth rate remained the same at 9%.
- 2004-05 to 2013-14: This period saw an increase in the growth rate to 5%.
- 2014-15 to 2023-24: The growth rate further accelerated to 7%.
- The increase in growth rates challenges the perception that the agricultural sector is in crisis, highlighting significant improvements over the last decade.
- Production Estimates: Government estimates indicate that cereal production rose from 185.2 million tonnes in 2004-05 to 303.6 million tonnes in 2022-23.
- However, household cereal consumption has remained relatively flat at around 153-156 million tonnes. This has raised questions about the accuracy of production estimates, with the gap between production and consumption widening significantly.
- Subsector Performance:
- Crops Subsector: The crops subsector grew at an average rate of 3% from 2014-15 to 2022-23, lower than the previous period's growth of 3.4%.
- Livestock and Fisheries: These subsectors performed much better, with livestock growth at 8% and fisheries at 9.2% during the same period. This indicates a shift towards non-crop agricultural activities.
- State-Level Insights:
- Top Performing States: Thirteen states recorded an average agricultural growth of 4% or more from 2014-15 to 2022-23.
- Underperforming States: Punjab, Haryana, and West Bengal showed much lower growth rates of 2%, 4%, and 2.8%, respectively, primarily driven by poor crop growth.
Key Drivers of Growth
- Market Demand: The increase in agricultural growth is largely driven by growing consumer demand for diverse products like fruits, vegetables, milk, meat, and fish.
- Diversification: Farmers have diversified into horticulture, livestock, and fisheries. This shift is supported by advancements in agricultural technology, such as:
- High-yielding crop varieties.
- Improved irrigation methods (e.g., drip irrigation).
- Enhanced breeding techniques in livestock.
- Consumption Patterns: There has been a noticeable shift in household consumption from basic caloric foods to those rich in proteins and micronutrients, indicating a changing diet among consumers.
Challenges Faced
Despite the positive growth trends, challenges remain:
- Income Disparities: Not all farmers are involved in high-growth areas like livestock and horticulture. According to the NSSO’s 2018-19 survey:
- 53% of farmers earned income from livestock.
- Only 5% were engaged in horticulture.
- 2% of agricultural households relied primarily on traditional crops (cereals, pulses, oilseeds).
- Low Yield in Certain Crops: Certain traditional crops like oilseeds and pulses still have low yields, leading to reliance on imports to meet domestic demand. In cotton, production levels have not improved significantly, remaining below previous highs.
- Support Price Impact: The existence of a minimum support price for crops like rice and wheat has not translated into improved growth for these sectors, indicating that demand-side factors and technological advancements may be more effective in driving agricultural growth.