

16th October 2023 (9 Topics)
2
Oct
3
Oct
4
Oct
5
Oct
6
Oct
7
Oct
9
Oct
10
Oct
11
Oct
12
Oct
13
Oct
14
Oct
16
Oct
17
Oct
18
Oct
19
Oct
20
Oct
21
Oct
23
Oct
24
Oct
25
Oct
26
Oct
27
Oct
28
Oct
30
Oct
31
Oct
How to read India’s latest employment data
Context:
Recently, the Ministry of Statistics and Programme Implementation has released the results of the Periodic Labour Force Survey (PLFS) for the period July 2022 to June 2023.
About PLFS data:
- PLFS collects data in two ways — Usual Status (US) and Current Weekly Status (CWS).
- Within usual status, the survey respondent has to recall their employment details from the last one year while in the CWS; the respondent has to recall the details over the past one week.
- Usual Status of Employment: The estimate of the labour force in the usual status includes;
- The persons who either worked or were seeking/available for work for a relatively long part of the 365 days preceding the date of survey and also;
- those persons from among the remaining population who had worked at least for 30 days during the reference period of 365 days preceding the date of survey.
- The estimate of the labour force according to the current weekly status approach is derived by considering those who worked for at least 1 hour or was seeking/ available for work for at least 1 hour on any day during the 7 days preceding the date of survey.
Parameters to analyses of PLFS:
- Unemployment Rate (UER): The UER has fallen significantly — from 6.6% to 5.1% over the last year (that is, July to June cycle).
- Simply put, 5.1% of all the people above 15 years of age who demanded work failed to get one.
- Labour Force Participation Rate (LFPR): The UER rate is calculated as a proportion of the population that is demanding work. But this population — which demands work — also goes up and down for a variety of reasons.
- The LFPR is a measure of the total population demanding work, and it is presented as a proportion of the total population that is above 15 years of age.
- India’s LFPR, which had been inching up, shot up significantly in the past year. As of 2022-23, 54.6% of all Indians above the age of 15 were looking for a job.
- LFPR for women: The data shows that female LFPR has gone up over the years but there were two discrete step-ups — one in 2019-20 (when India’s GDP growth rate had slowed down to less than 4% and this was before the Covid pandemic hit) and second in 2022-23 when it rose to 31.6%.
- Worker Population Rate: The WPR is the percentage of persons employed among the persons in the population.
- Thus, instead of looking at how many demand a job and how many fail to get it, the WPR simply gives a measure of how many people have a job as a proportion of the total population.
- WPR among women: This parameters was included specifically to showcase the women participation.
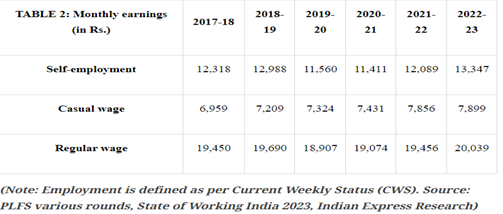
- Monthly earnings: The PLFS reports also provide a sense of how much do people earn in different types of jobs.
- Distribution of workers: The data shows that self-employment has risen and jobs in the other two categories have fallen in proportion.
More Articles